Quartic.Al
QuarticAl is an Enterprice scale Al platform startup focusing on Industry 4.0 helping in automation of manufacturing process using data analytics, insightful models and drive operations with high accuracy
and fidelity.
My Contribution
Role: UX Architect
-
My responsibility was to revamp the design system, pricing platform, and website to accommodate future industry additions.
-
I actively participated in all stages of discovery and ideation in collaboration with the Customer Experience Head, who served as our primary point of contact, gathering inputs from clients and enterprises to define product specifications.
-
Designs were thoroughly tested with the Customer Experience team and Subject Matter Experts (SMEs) before being converted into interactive HTML prototypes for developers to implement.
-
The development team was based in Bangalore, India, while the Data & Analytics team operated from Canada, and the Sales team was located in San Jose, USA.
Understanding Quartic.AI
QuarticAl caters to improve Industry 4.0 Manufacturing Process with their unique AI Models, Algorithms, Business and Data Interlligence giving edge over Batches, Runs, Designing Experiments, Simulate real world experiments virtually, Compare experiments, Finding contributors and outliers.
QuarticAl plans to extend its Industry presence from Life science and Chemicals, now will cater into other industries, build new models, extend tools, simulation and customization. This require a new and agile solution that is easy to build and extend based on end user requirements.

Prepare Data
User-Friendly Data Input, Tools, Automated Data Capture,
Standardized Templates,
Data Normalization, Data Validation, Data Integration and
Metadata Tagging.
Data Governance, Scalable Data Infrastructure,Feature Engineering, Labeling for AI, Data Interoperability
Process Data
Rules, AI Models, Algorithms
Quartic Intelligence,
Complex Event Processing
Batche Processing,
Runs, Design of Experiments,
Simulation, Virtual Experiments,


Actionable Insights
Comparision
Rerunning experiments from previous Experiments
Data Visualization & Intelligence
Contributors & Outliers Detection
Challenges & Opportunities
Extending Industries
The platform started with Life science & Chemicals and plans to enter Food & Beverage, Metals & Mining, Oil & Gas, Paper & Tissues, Packaging, and more
Scalable Platform
The platform that supports reusability, scalability, and agility to accommodate new and existing features across various industries.
Usable, Simpler platform
The platform is designed to be simple, progressive, and intuitive, guiding users effectively at every stage as needed.
Extending Models & Algorithms
Create new models and algorithms, as well as extend existing ones, to cater to new industries.
Agile Saas platform
The platform that scales rapidly internally and supports seamless customization with client systems and other platforms.
Platform Users
Understanding users, their intention, goals and expectations. Most of our users are very strong technically and are aware of industry standards, convention, technology, data type and aware of tags.
SMEs
Managers
Supervisors
Technicians
Researchers
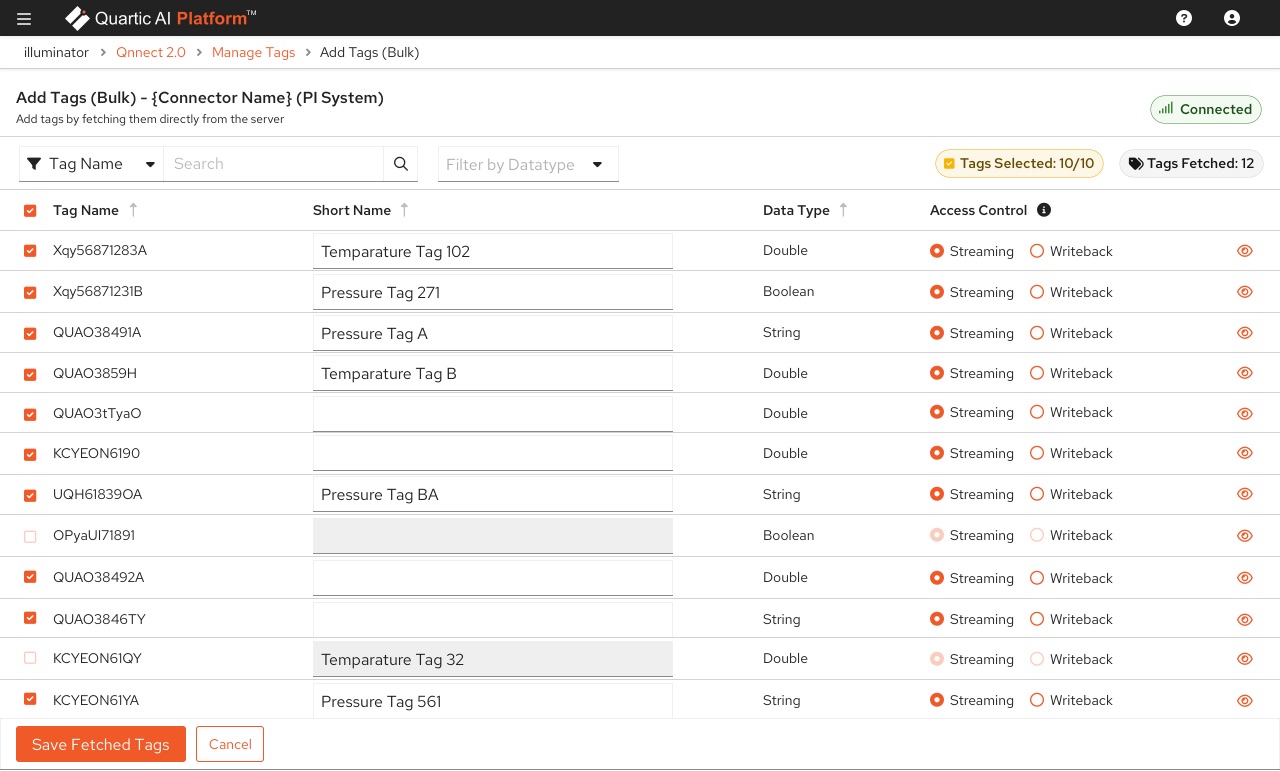
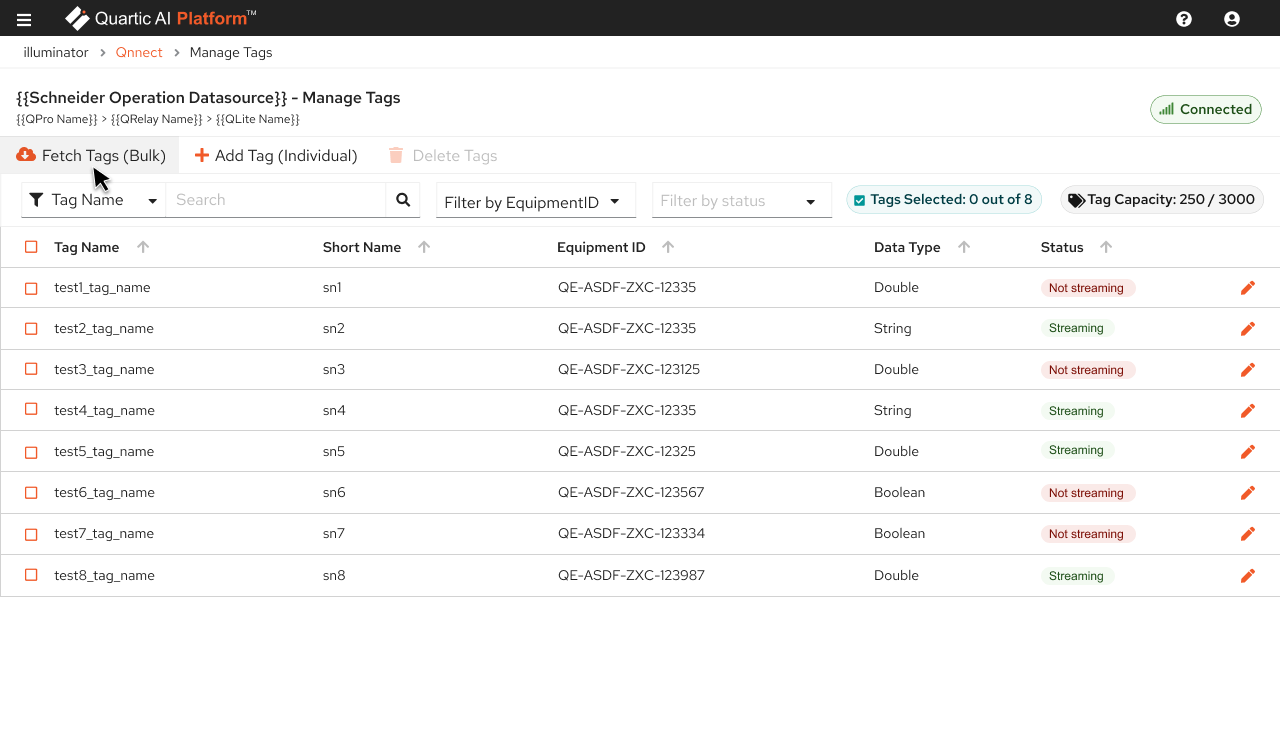
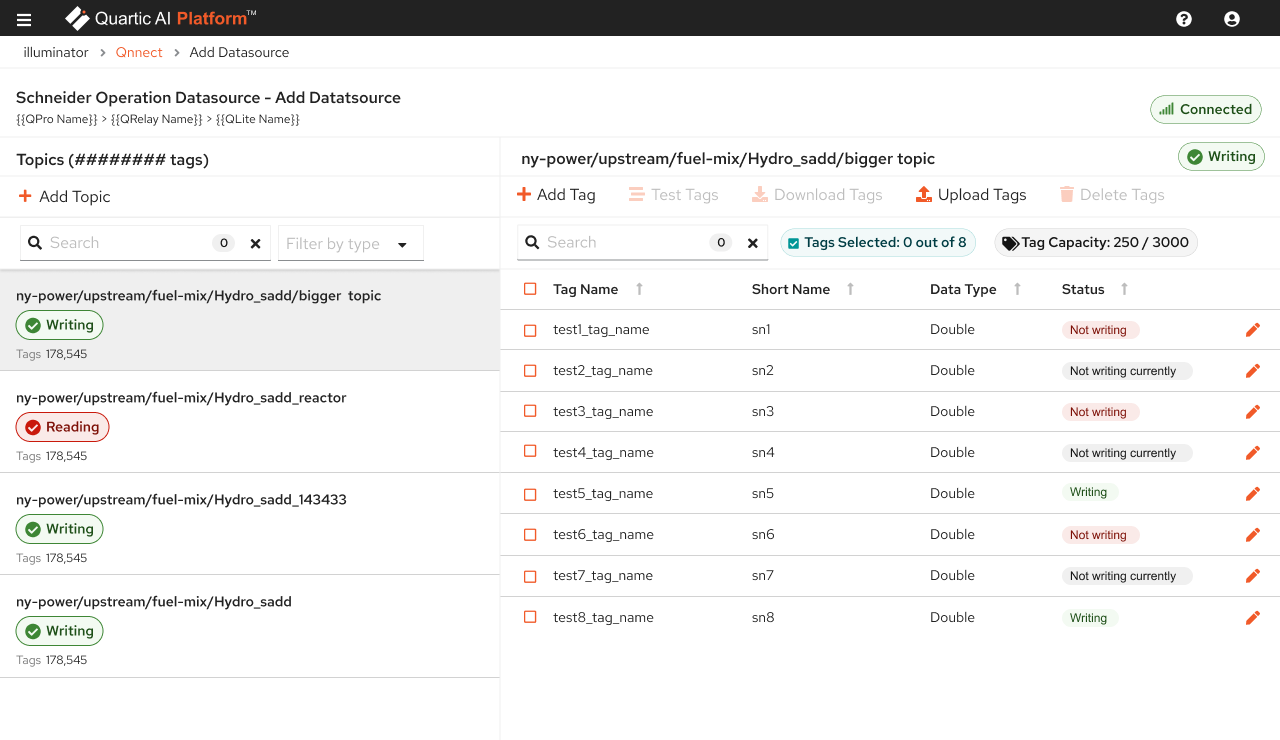
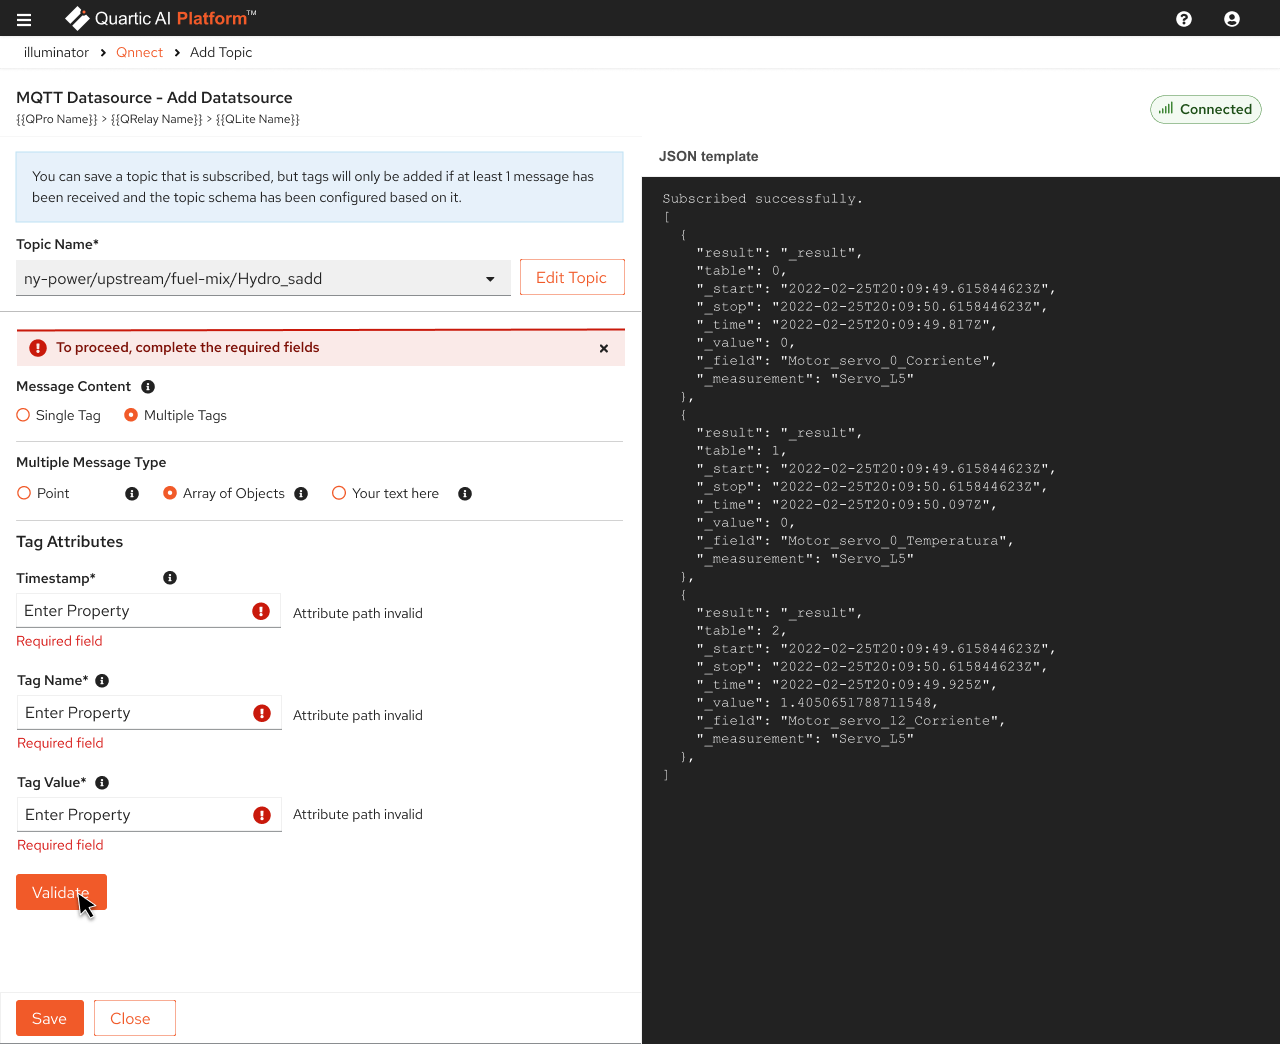
Platform Components
The below is the main and the sub components of the platform that will be custom tailored to clients
based on what service is requested and this is controlled and available from Administrator panel. Most of the components have CRUD operations.

Exploration
Design System & Components
Identifying the right design system was crucial to addressing both design and development challenges, as the front-end technology used was React. Significant time was invested in building visual components that are data-friendly, scalable, and dynamic to handle large data sets effectively. This required creating custom controls for specific parameters to meet the demands of the application.
IBM - Carbon
Sales force - Lighting
Redhat - Pattern Fly
Atlassian Design system
Ant Design
Upon closer inspection, it was determined that Red Hat's PatternFly was the optimal choice among various options due to its alignment with the required components. It provided ready-to-use elements that required minimal modifications and supported seamless design and UI creation using HTML for interactive functionality.
Process flow & Task Analysis
A detailed flowchart for each process was documented, covering different stages of the product lifecycle as all these processes are unique and unavailable in public. This included mapping the flow from input data through various stages such as preparation, conversion, processing, detection, simulation, findings, contributors, outliers, and summary, culminating in a comprehensive report.
Please mind detailed flows and process is not shared as this is enterprise solution and access is restricted.


Design Ideation
The previous design was clean and straightforward, supporting a simple flow. However, as requirements grew to include processing, model additions, tag types, custom functionality, reusing existing experiments to initiate new ones, chart nesting, multi-level CRUD operations, and console logging, the need for a new design capable of handling multiple levels of input and runs became apparent.

Understanding Working
For each process, the available parameters, dependencies, influences, operations, and so on were documented to aid understanding. Actions available were also noted, along with any unknown information, to make it intuitive and stage-oriented.

Usecases - Feature Description
All possible cases were listed to understand the scope and corresponding actions. The respective statuses and feedback were recorded to assist the team in gaining a clearer understanding. Later, this information will be refined into a concise format to serve as user guidance.


Design System, Color, Style & Component Library
All states, message, status, steps and component type were built as part of ideation before hand starting the design this helped us to build screens once the process was defined.
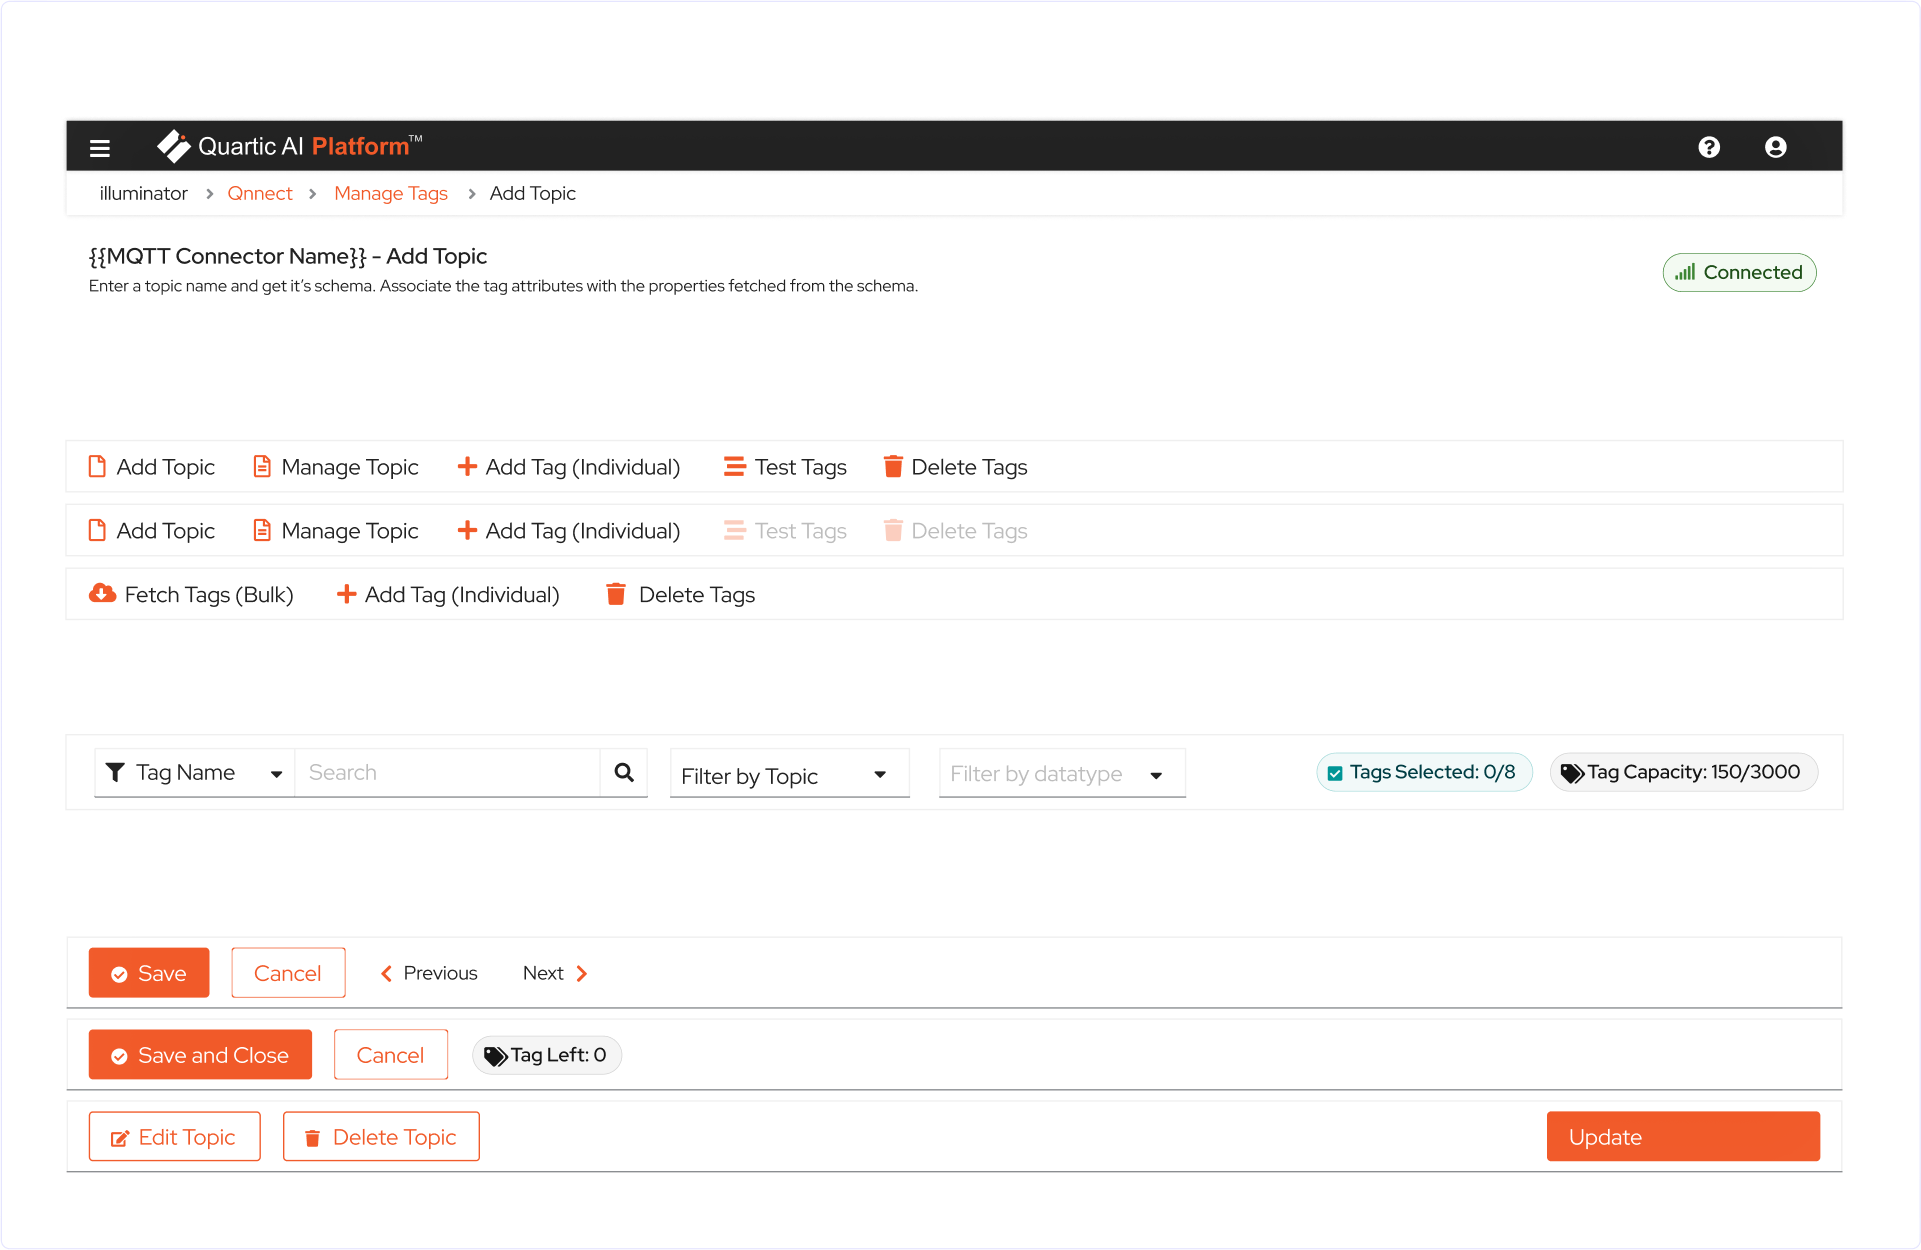
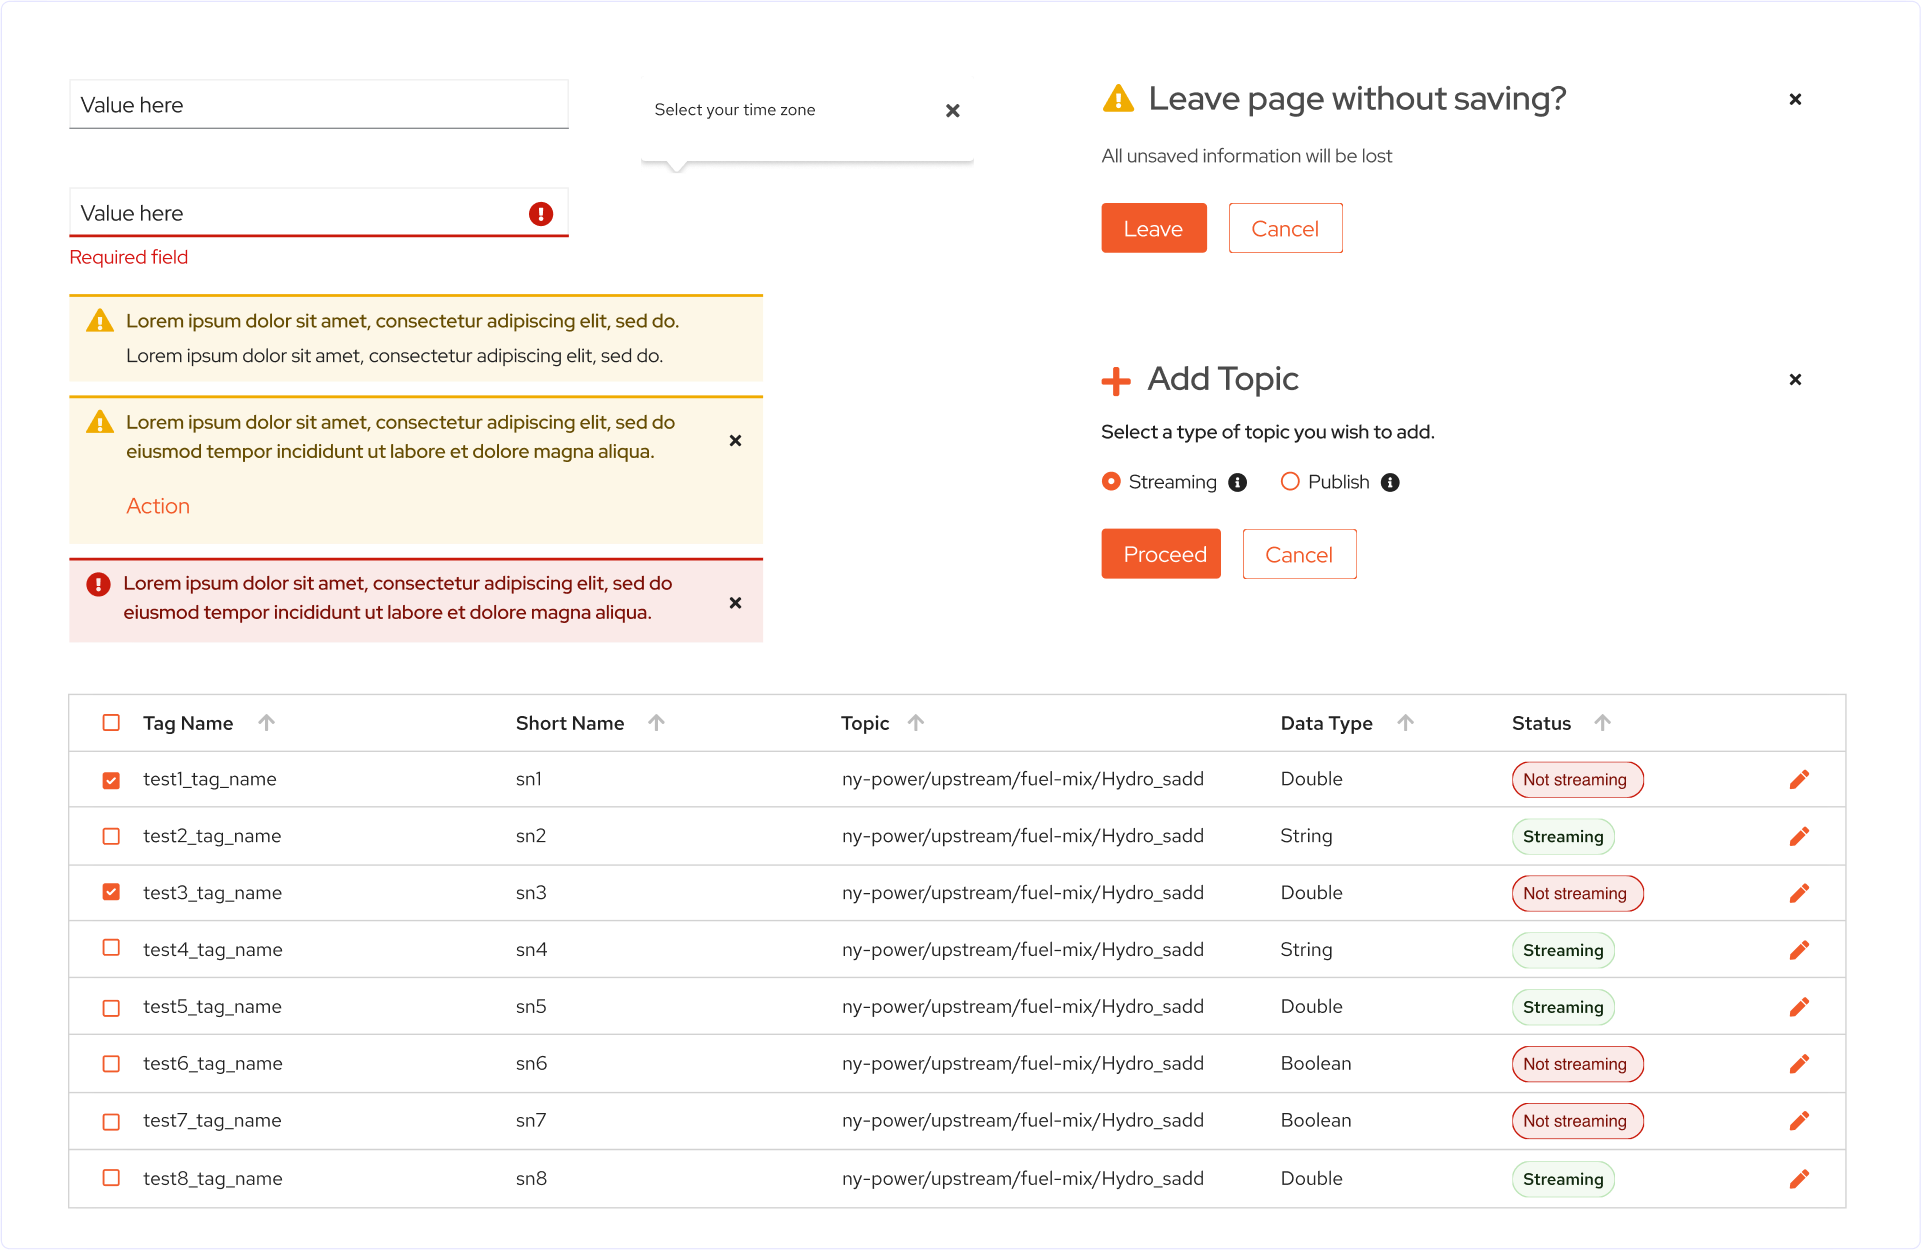
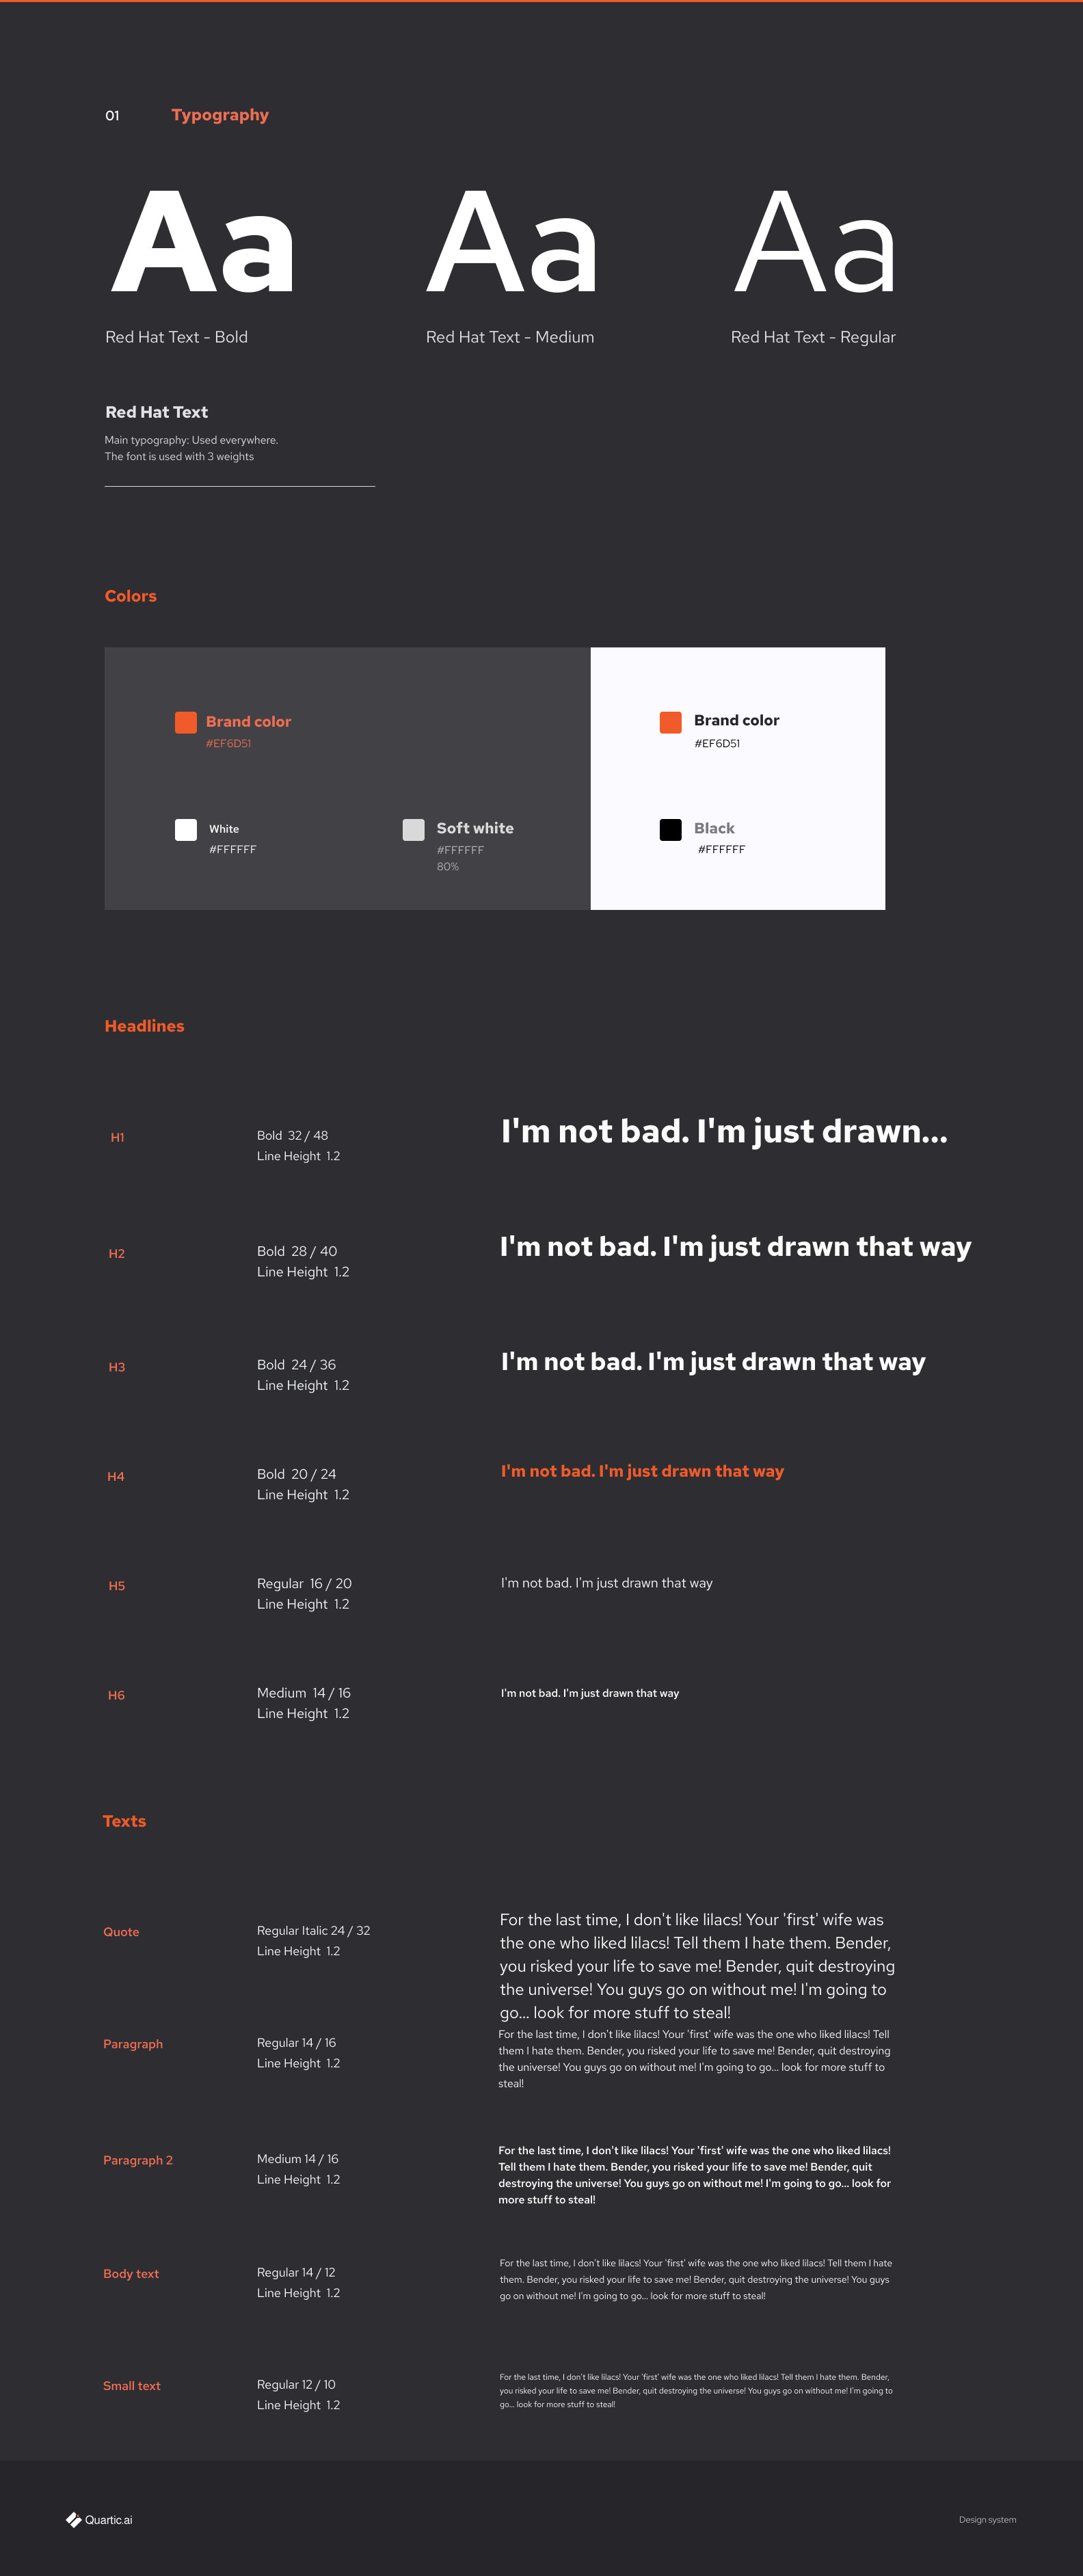
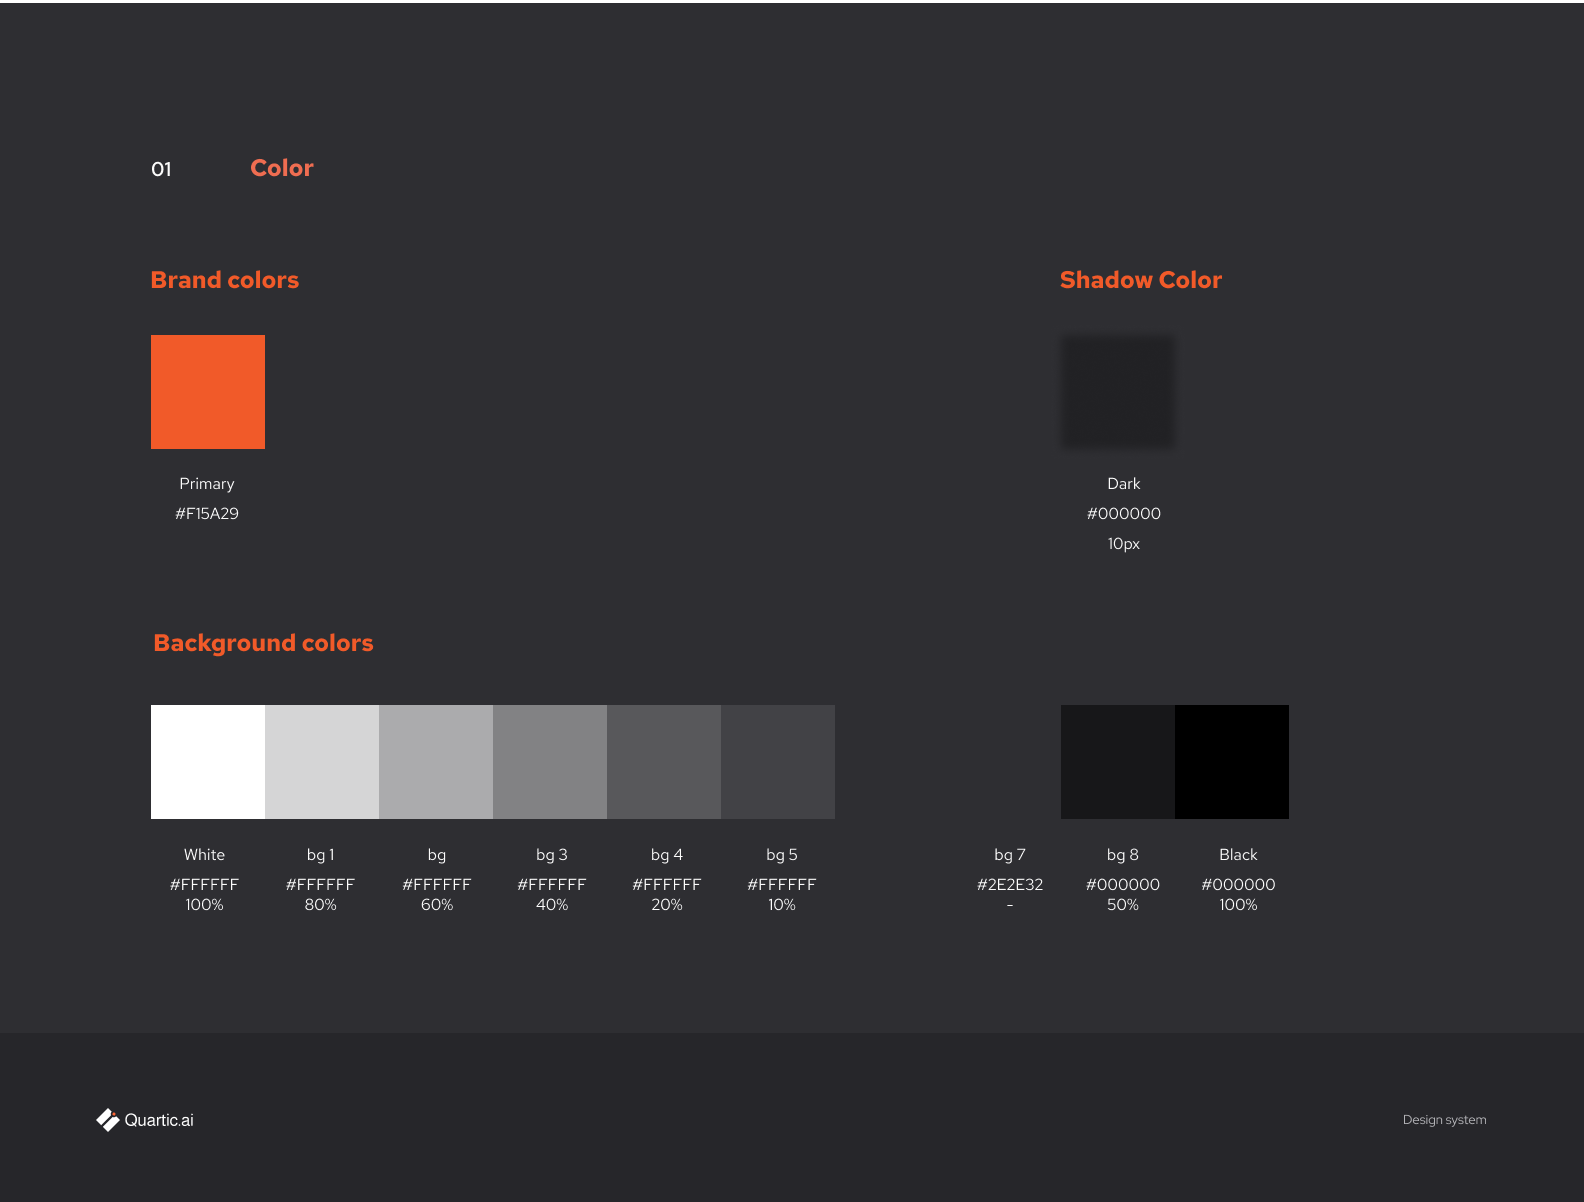
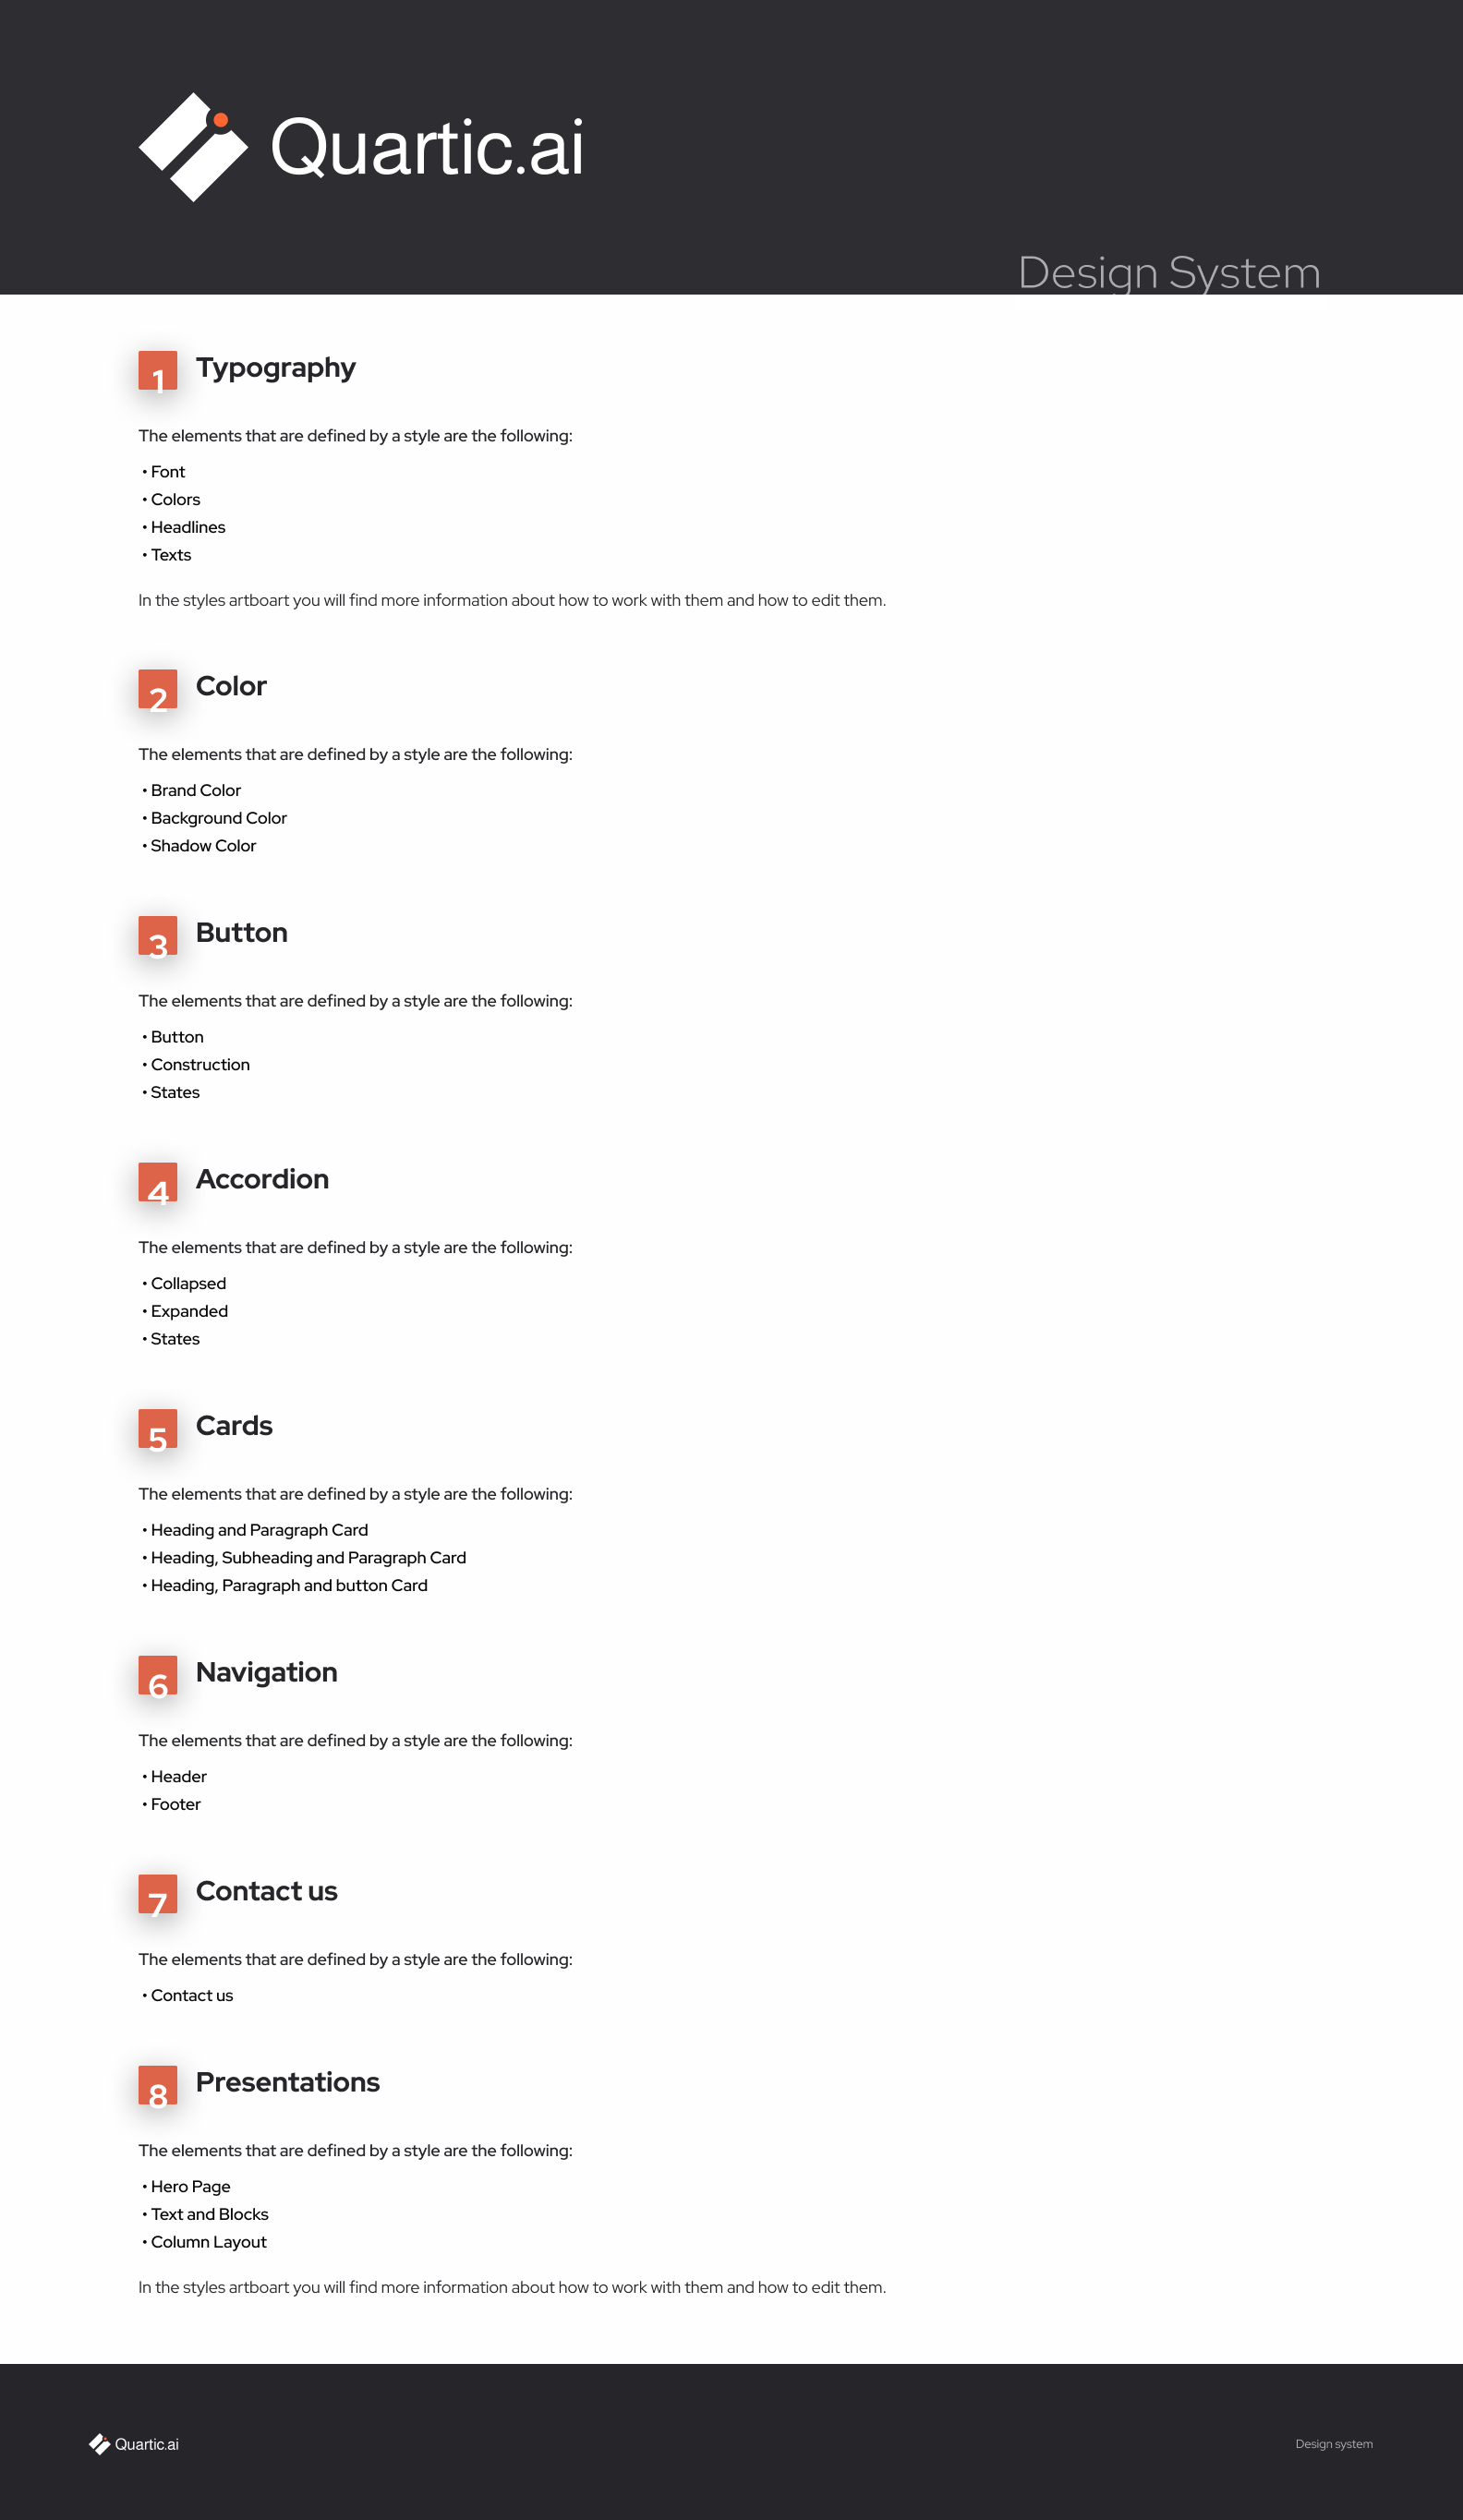
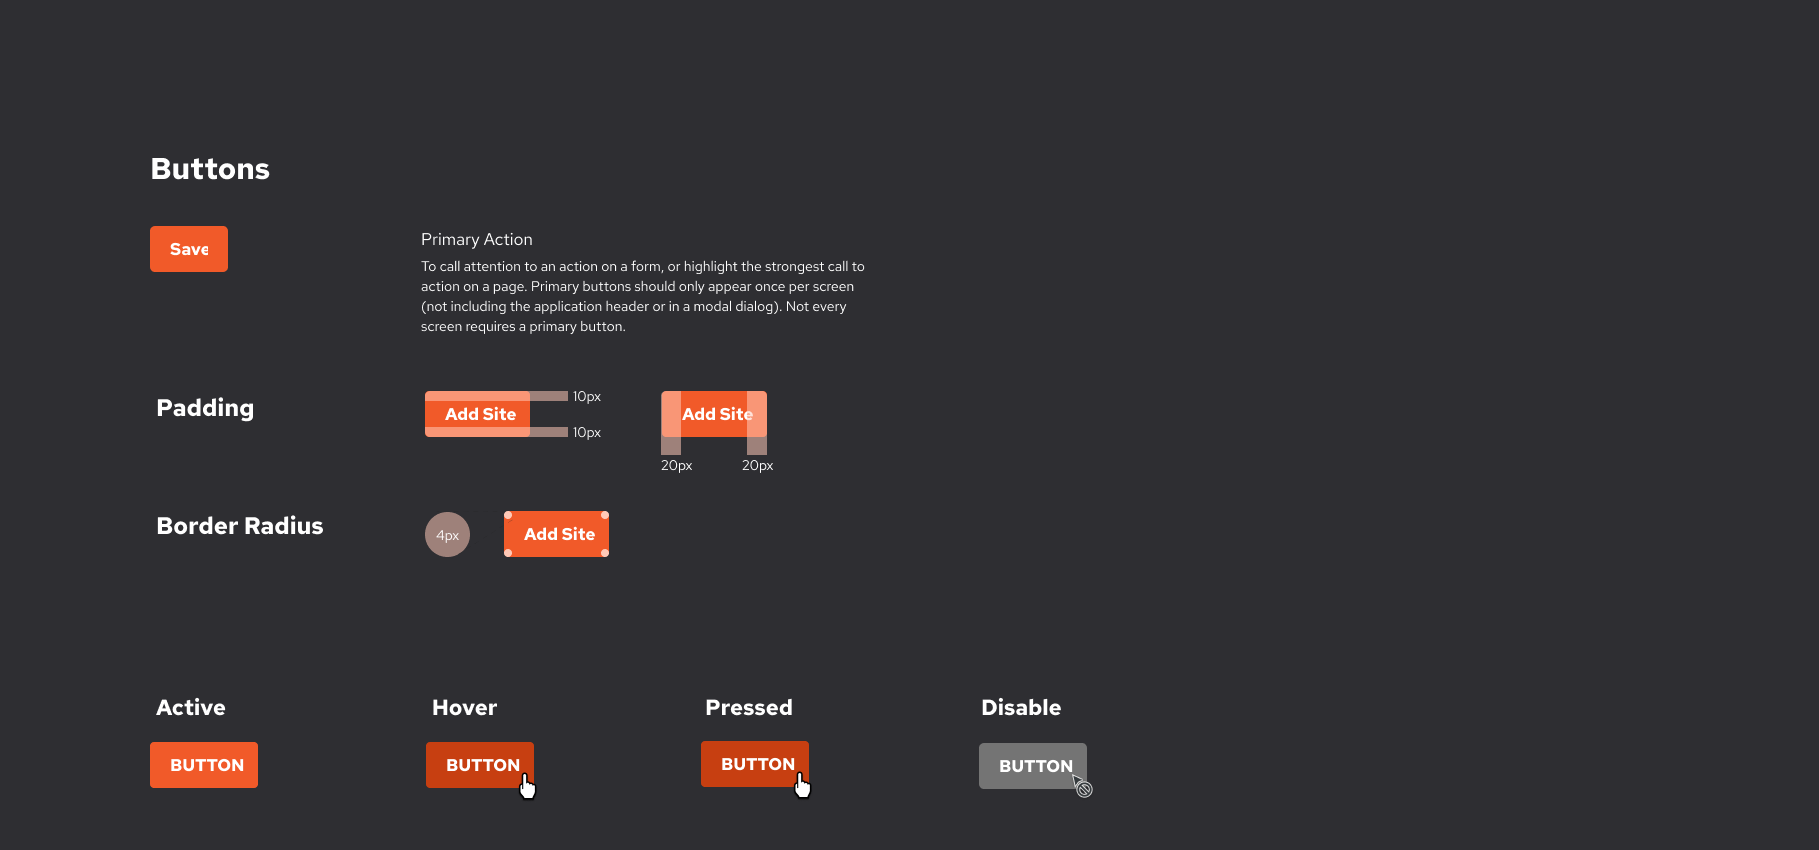
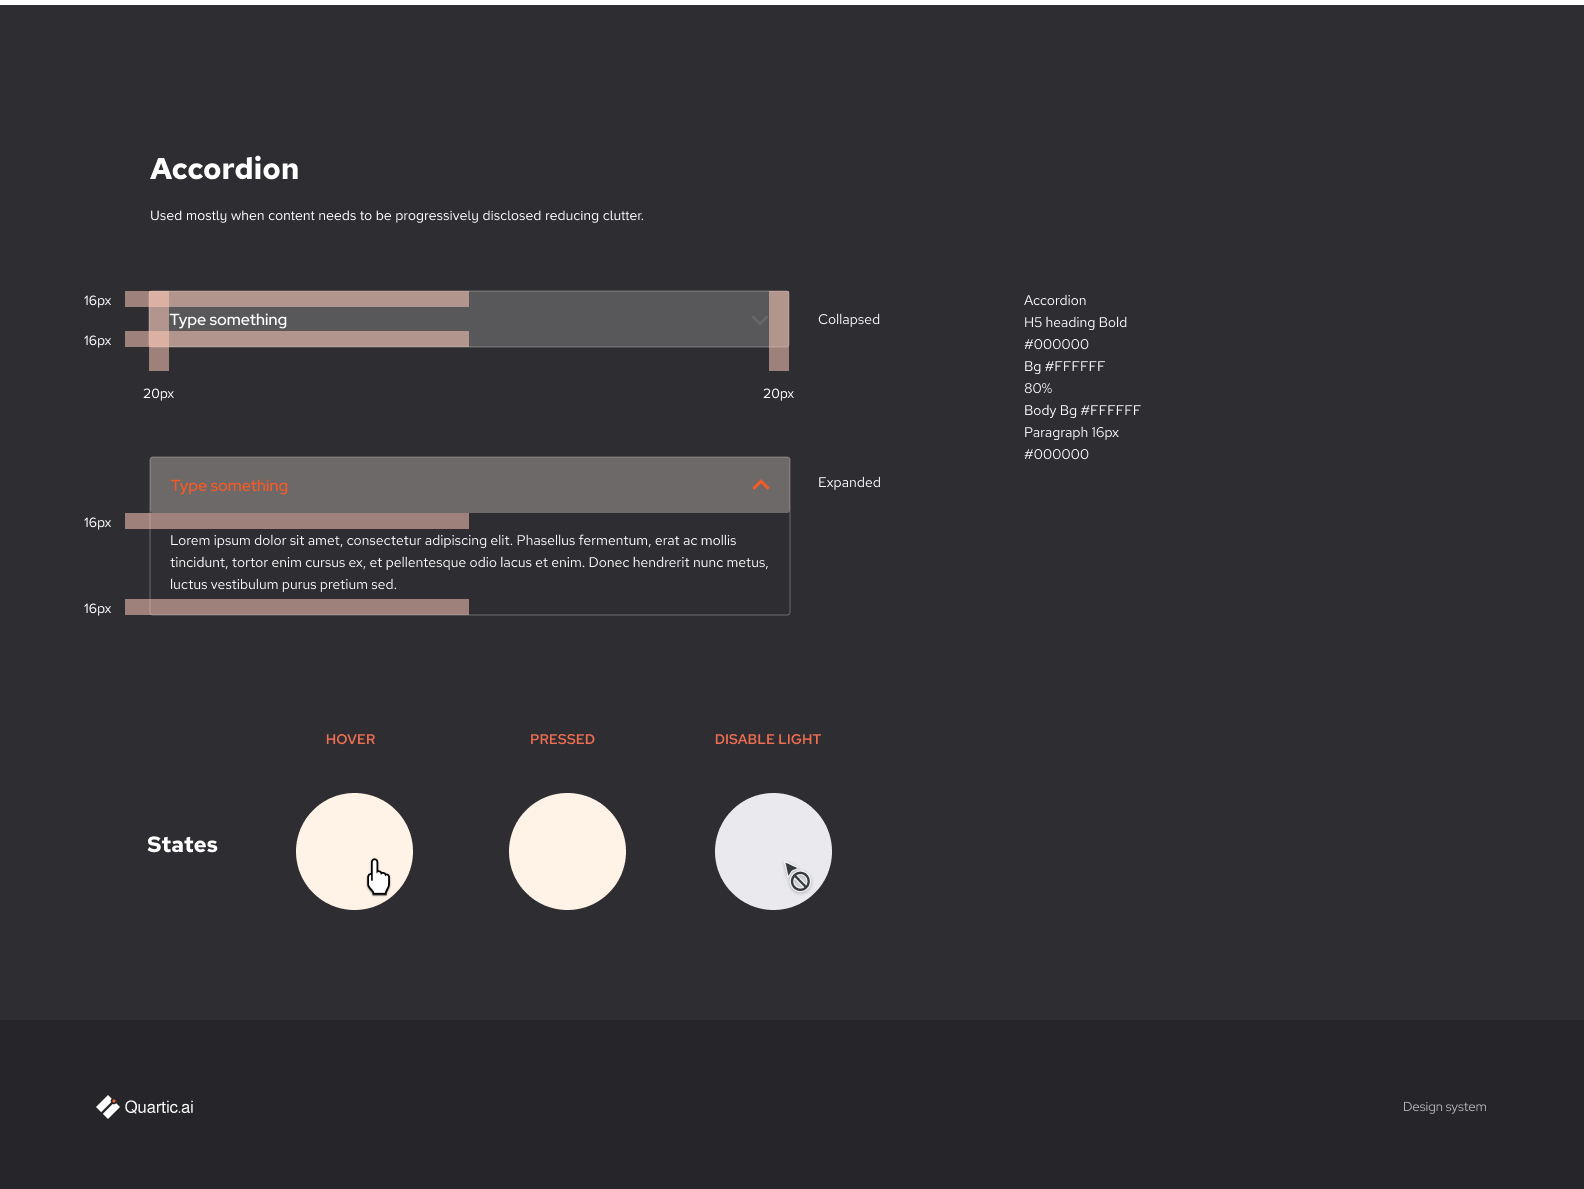
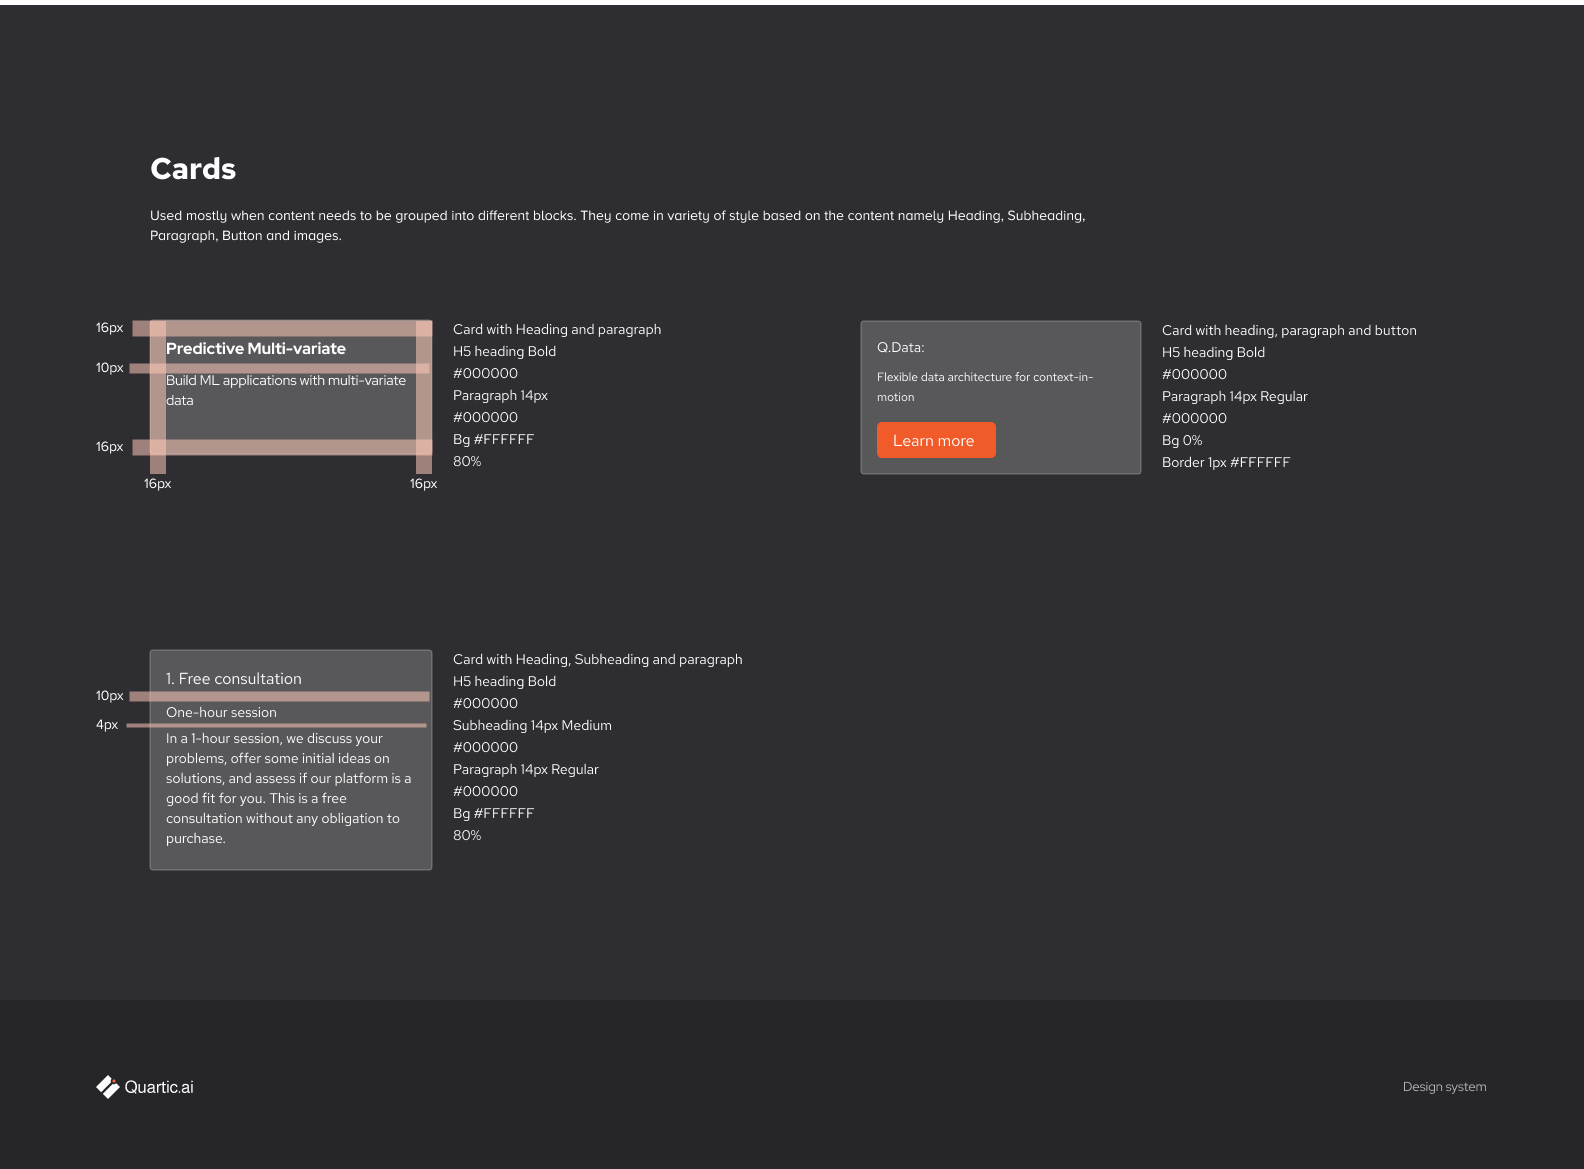
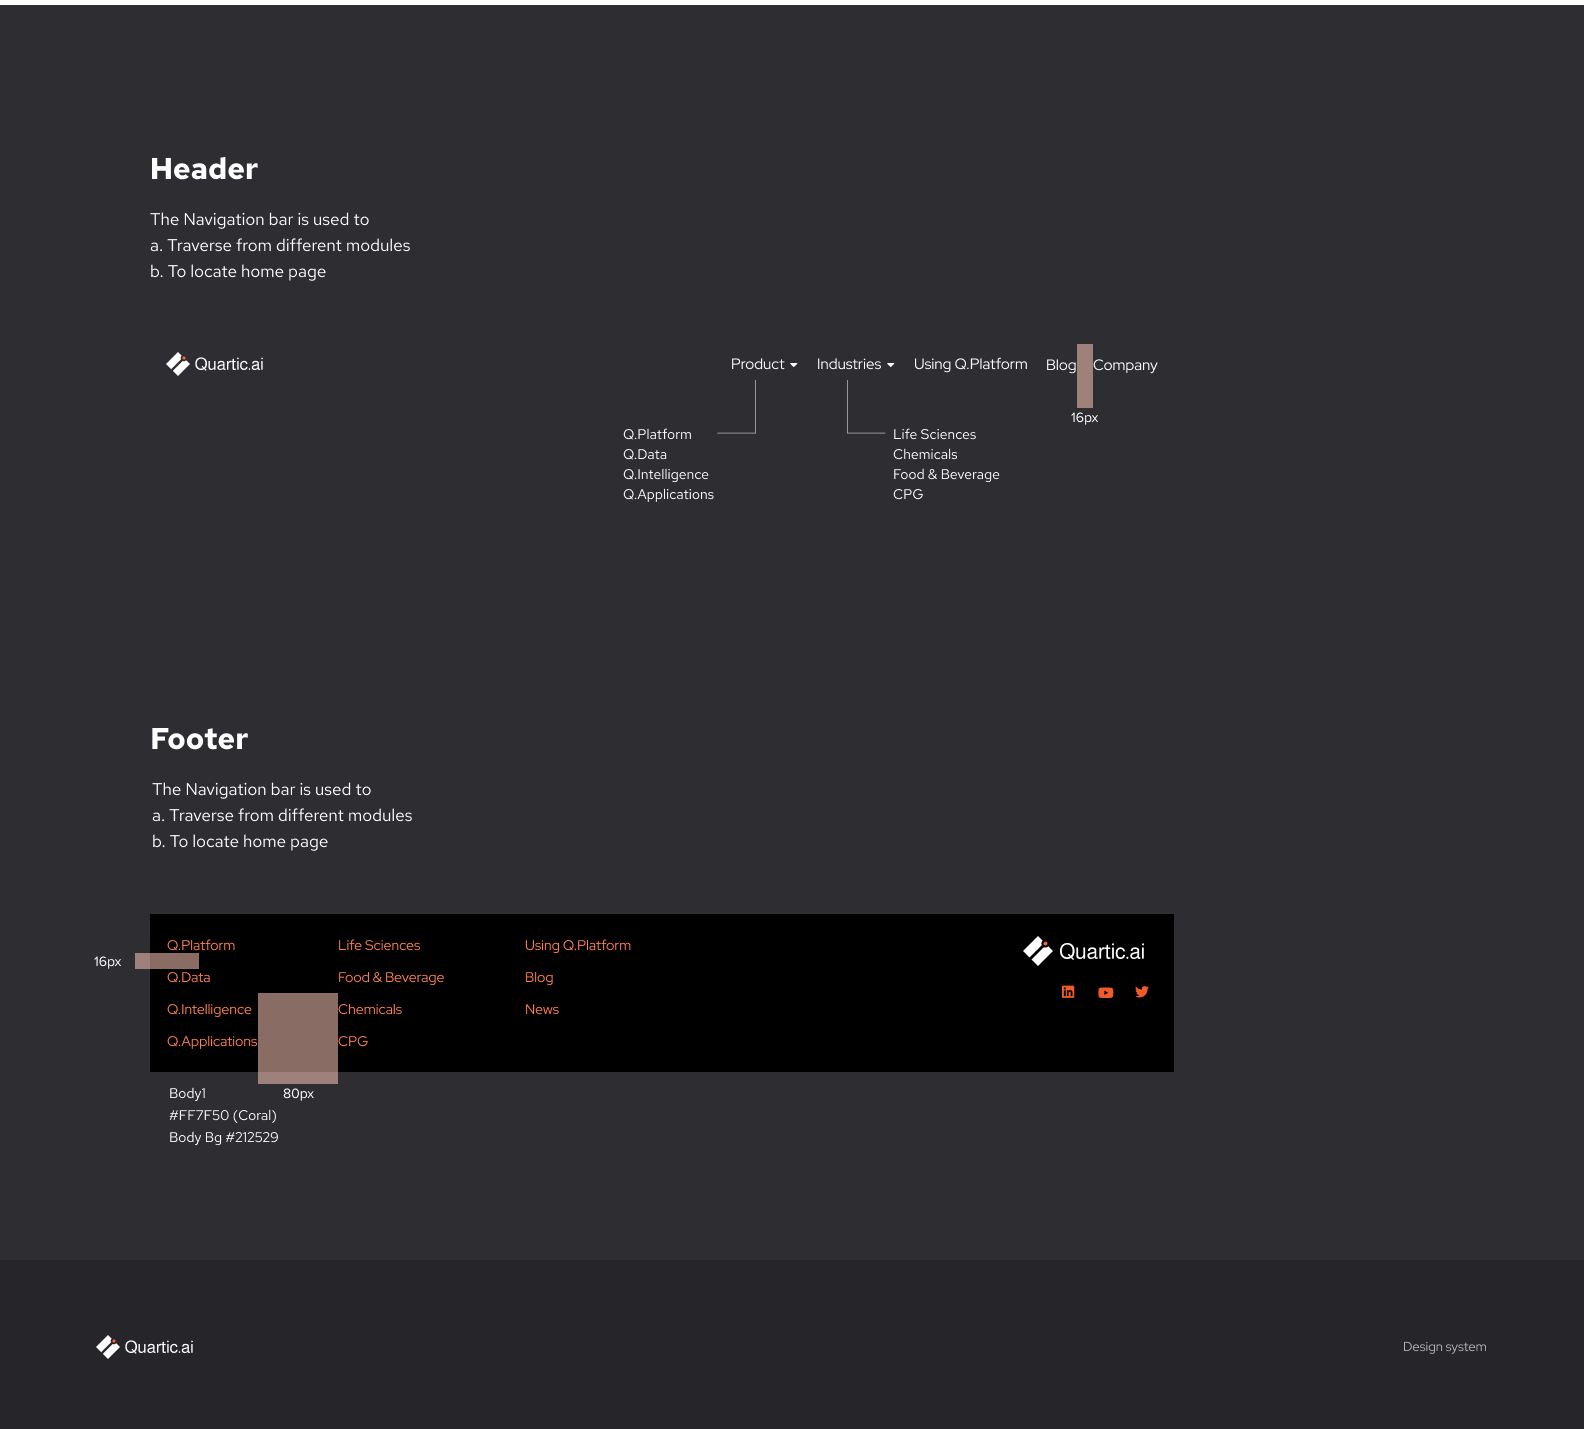
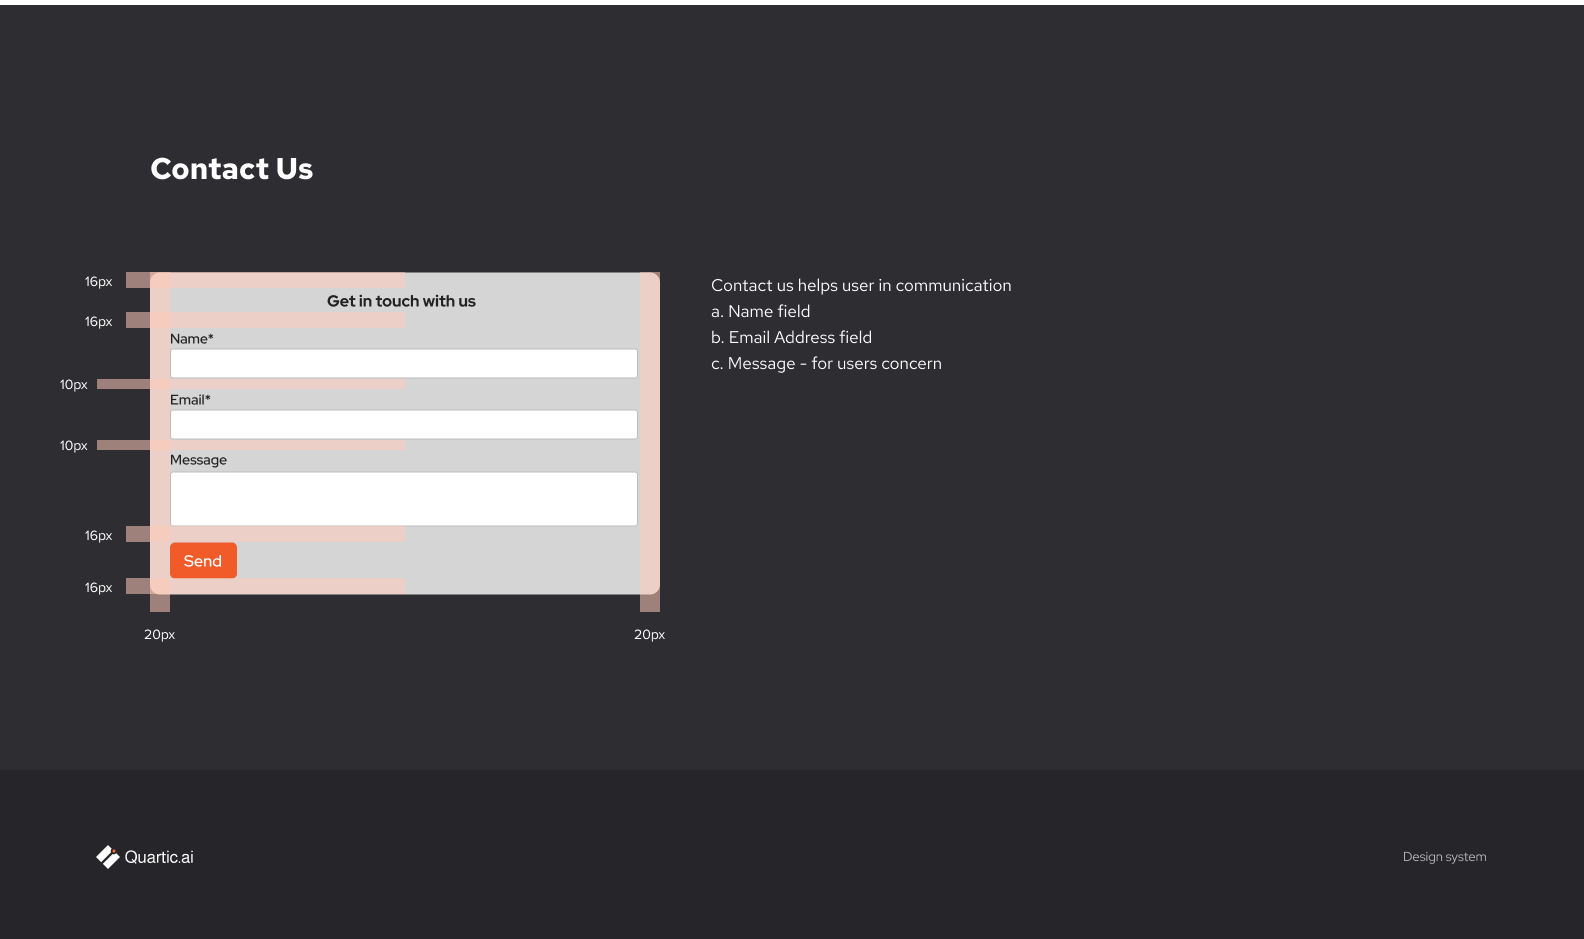
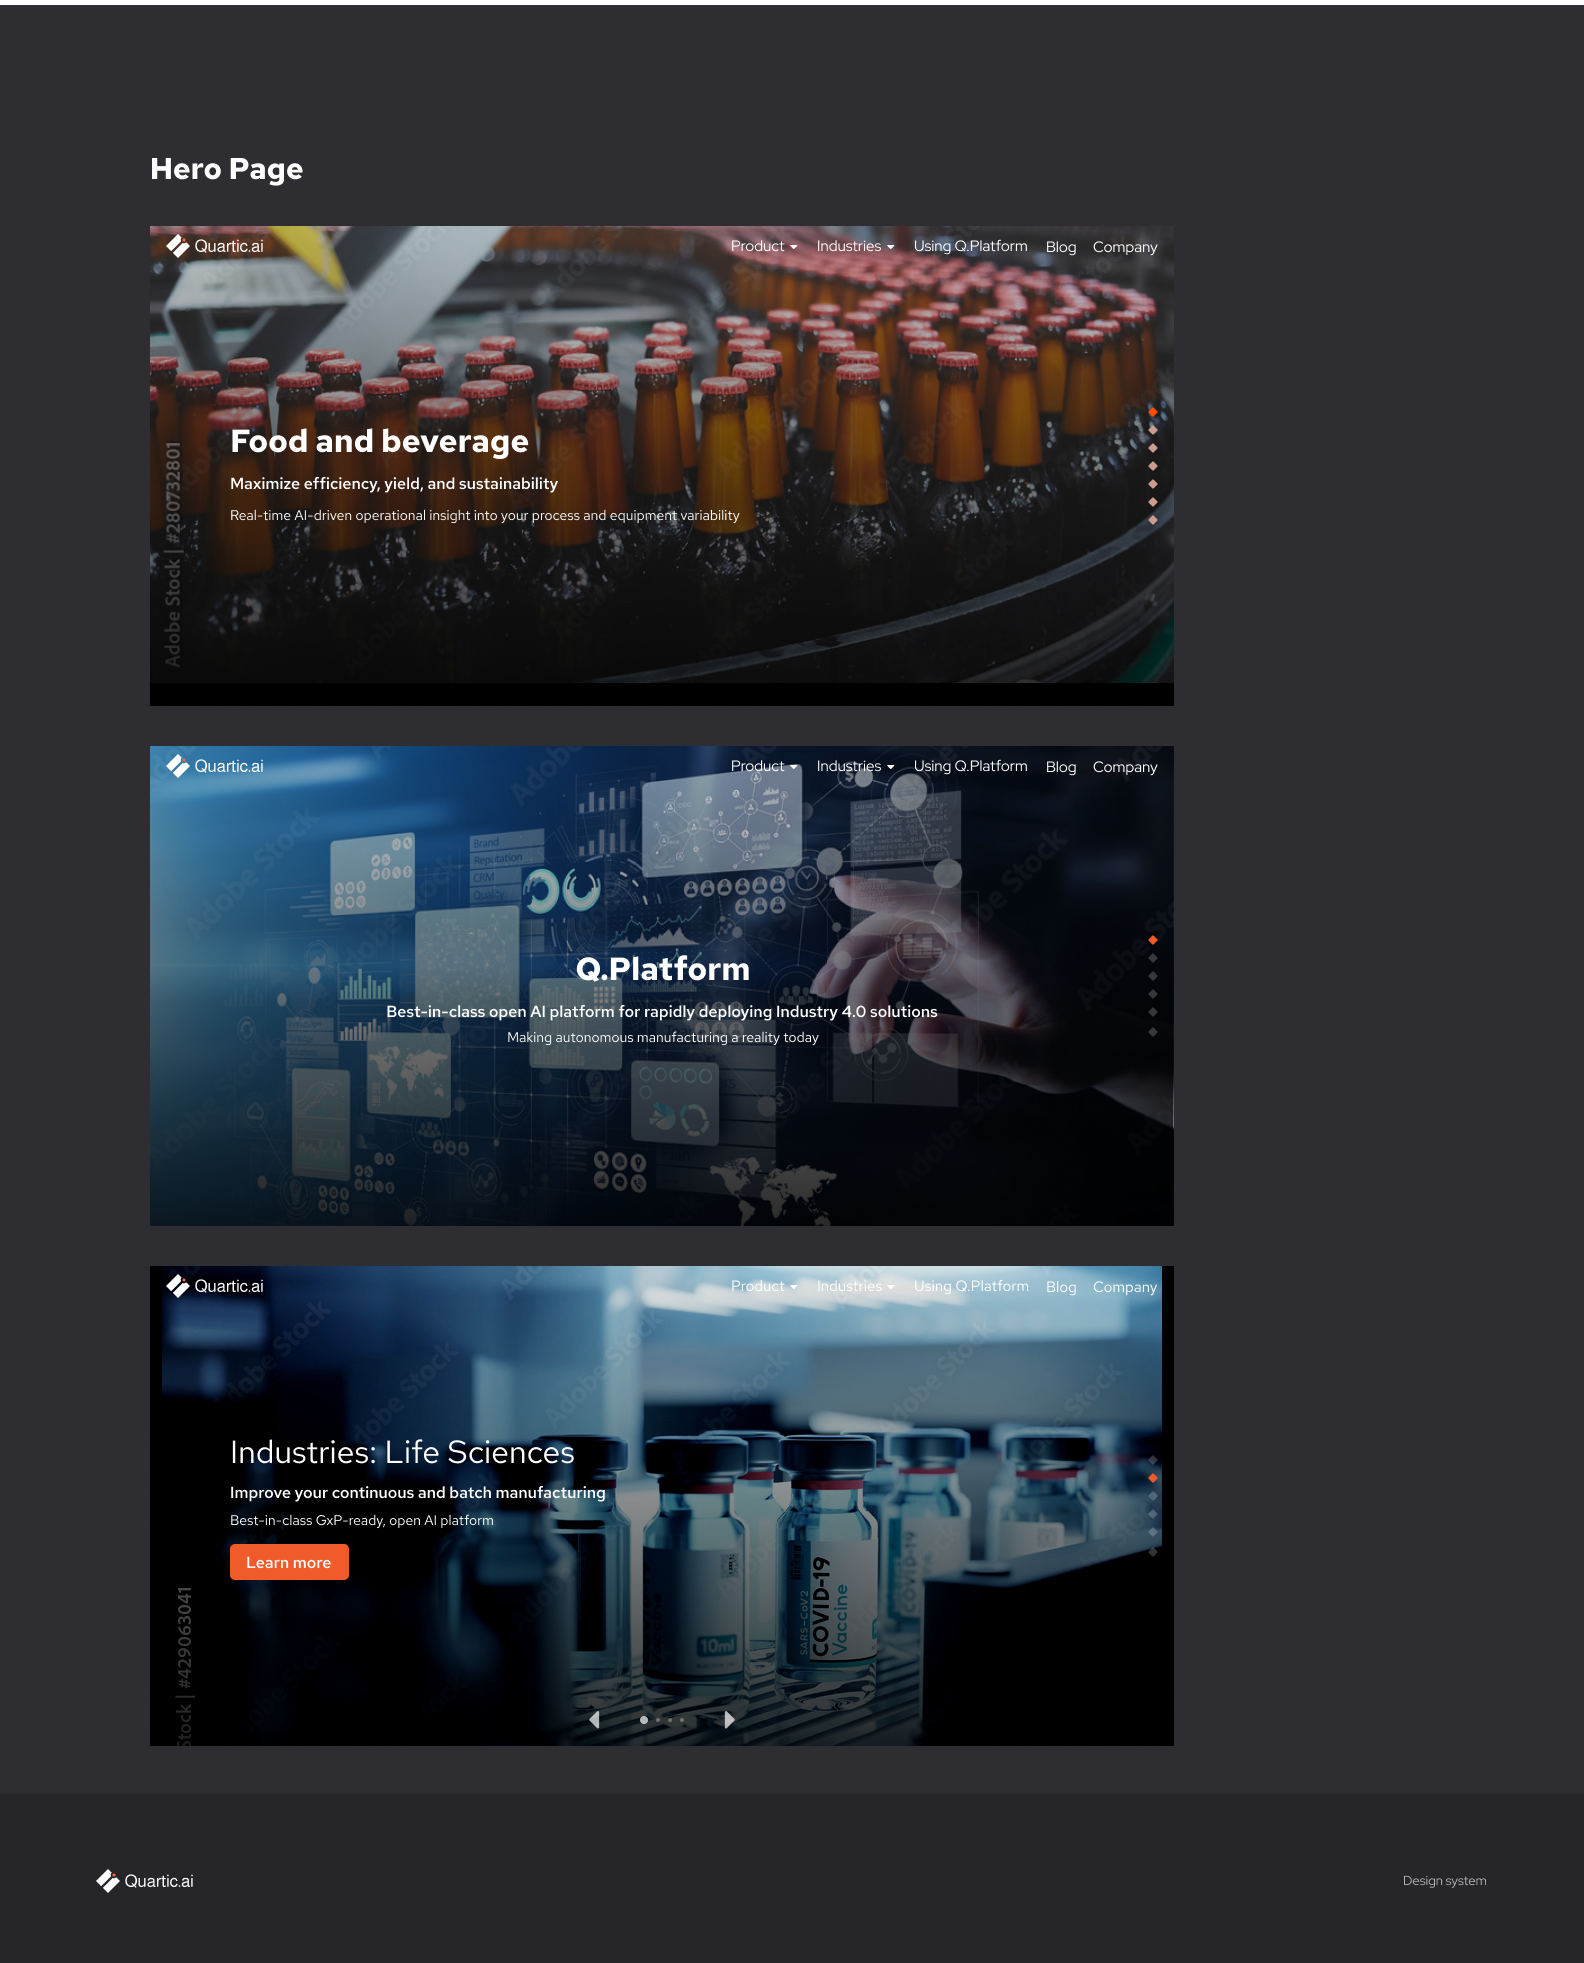
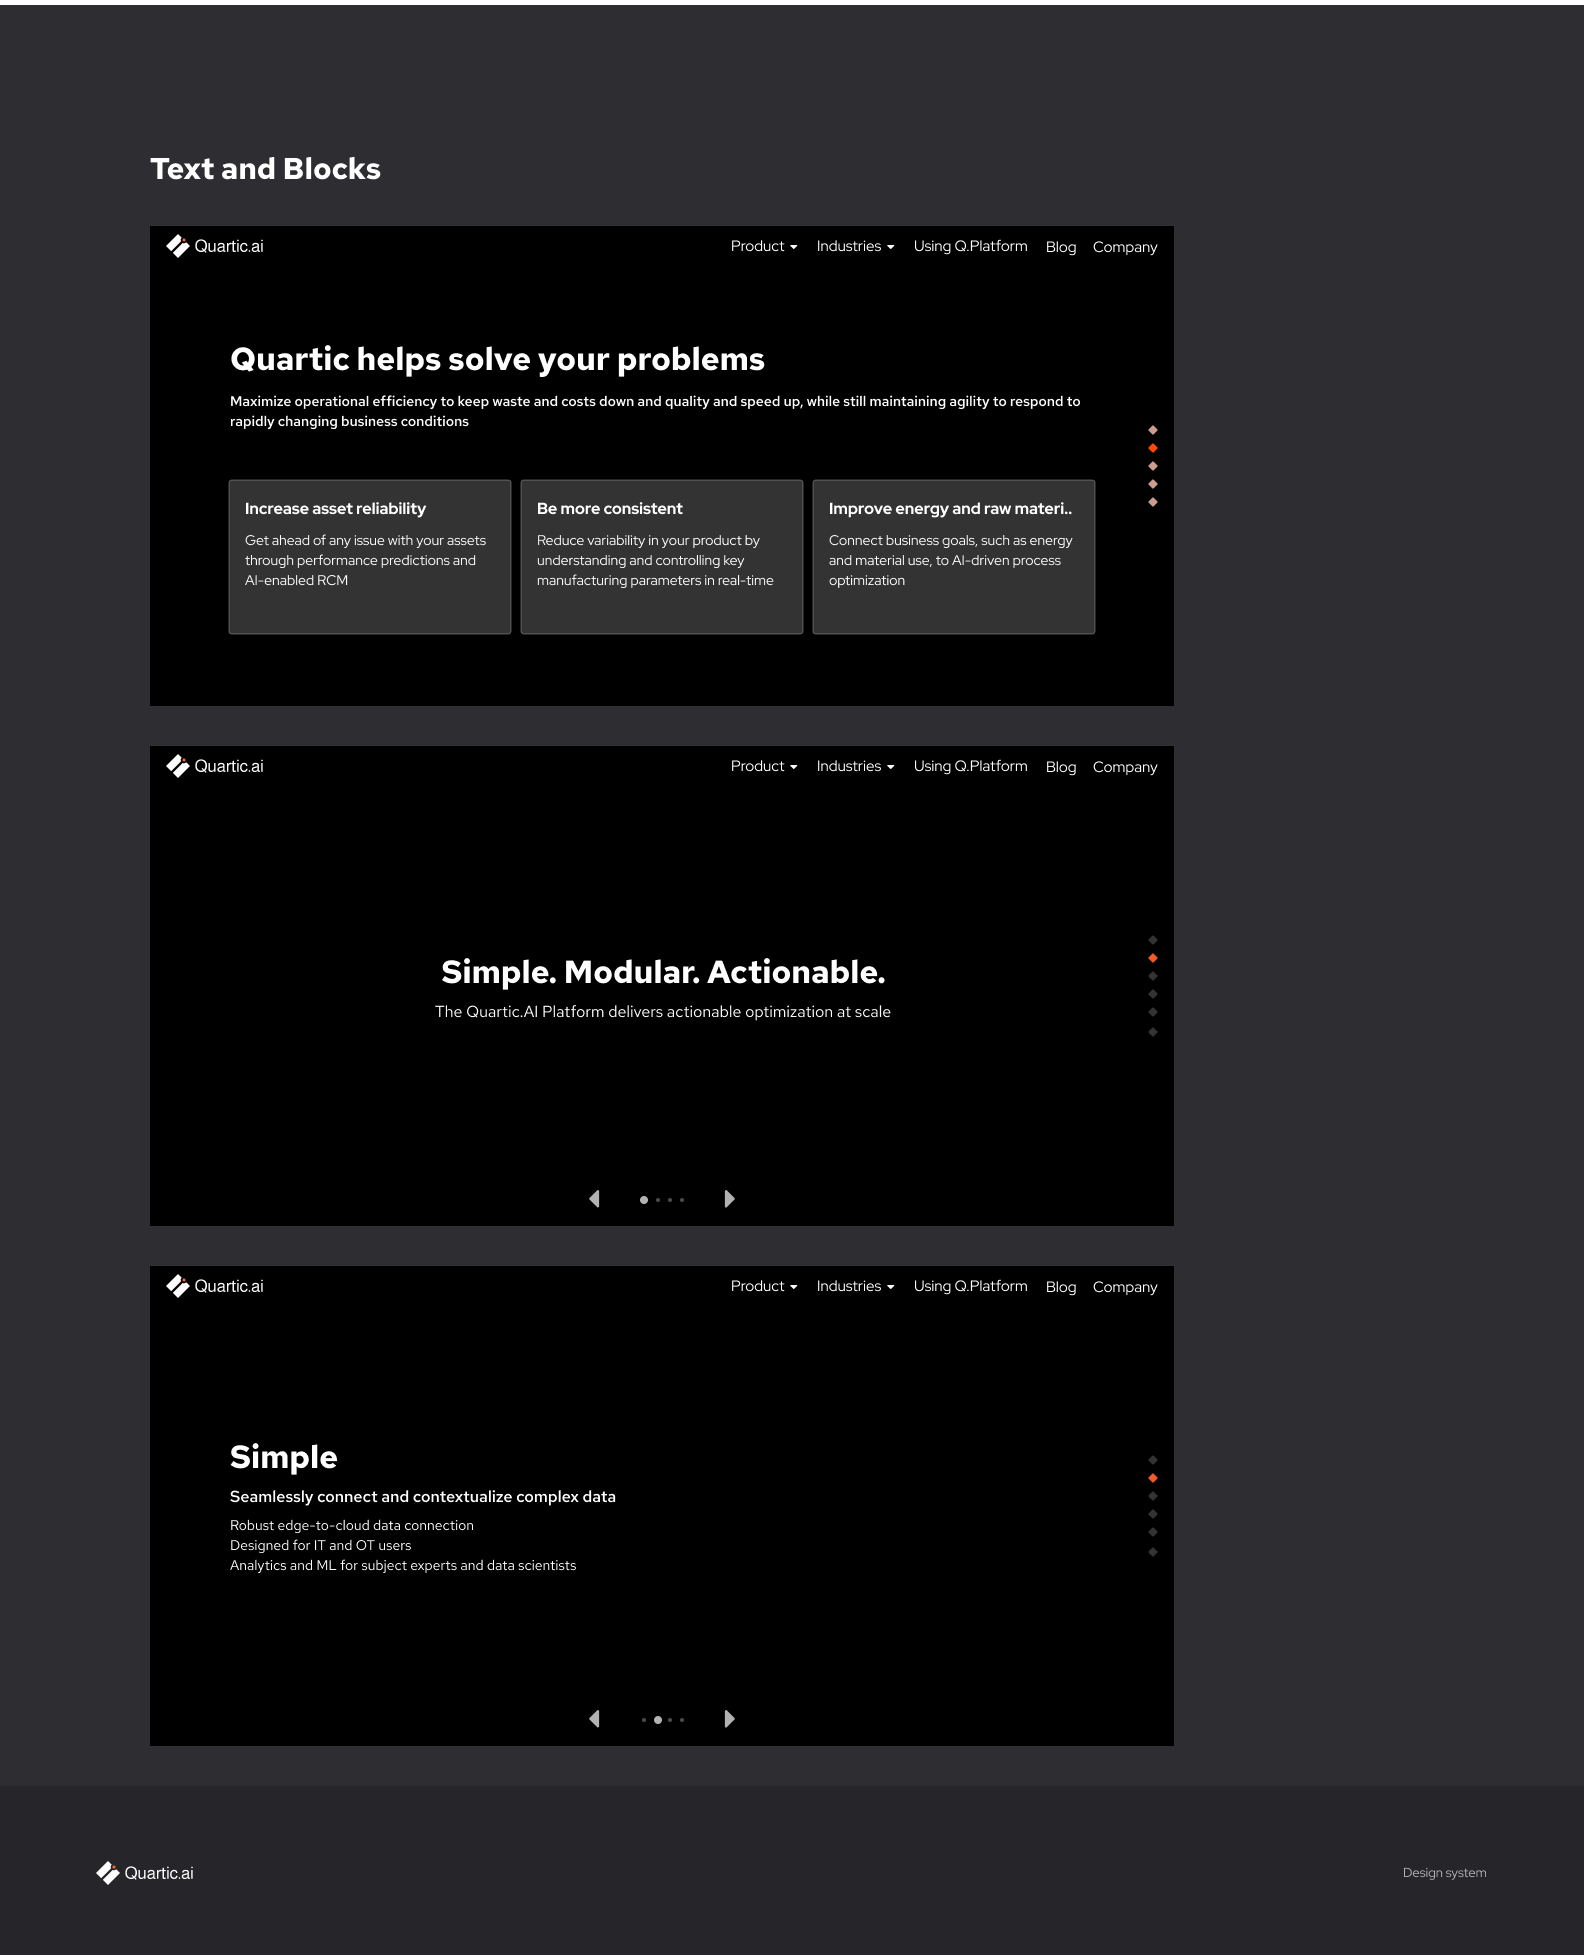
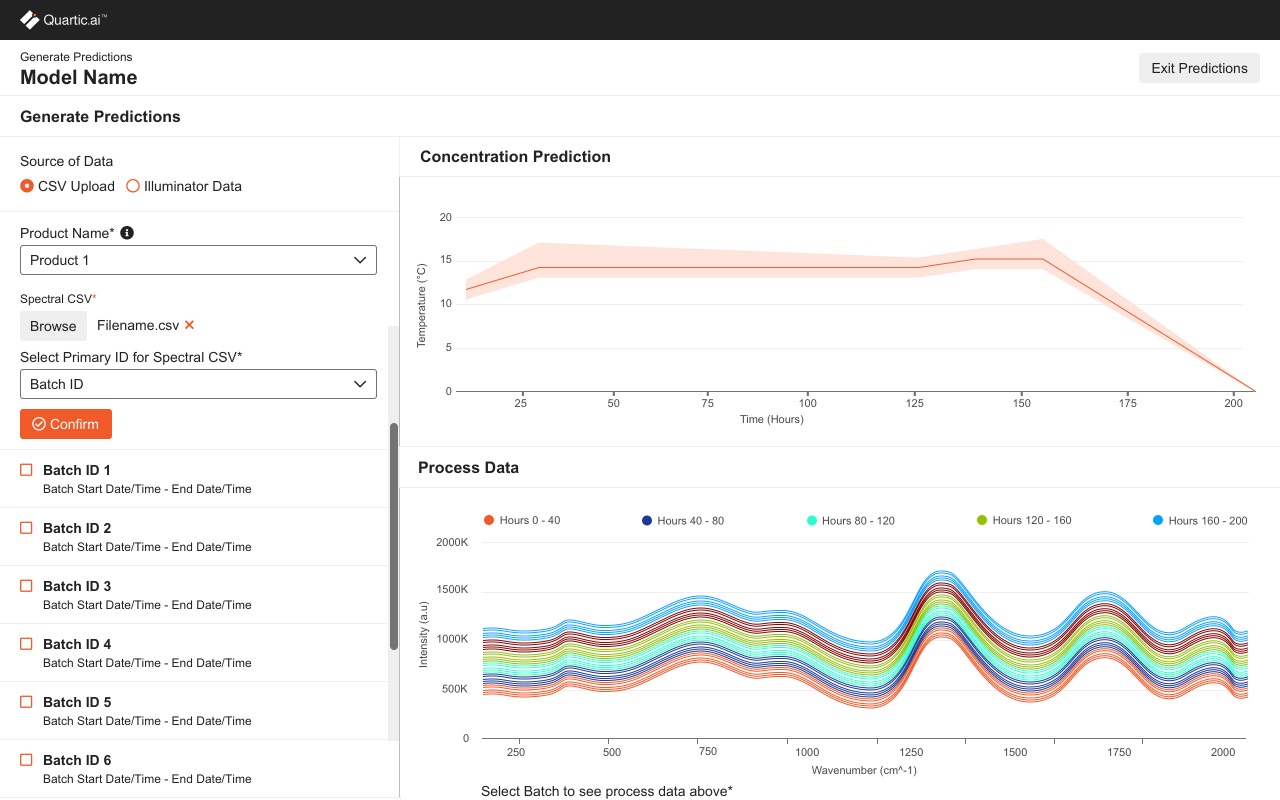
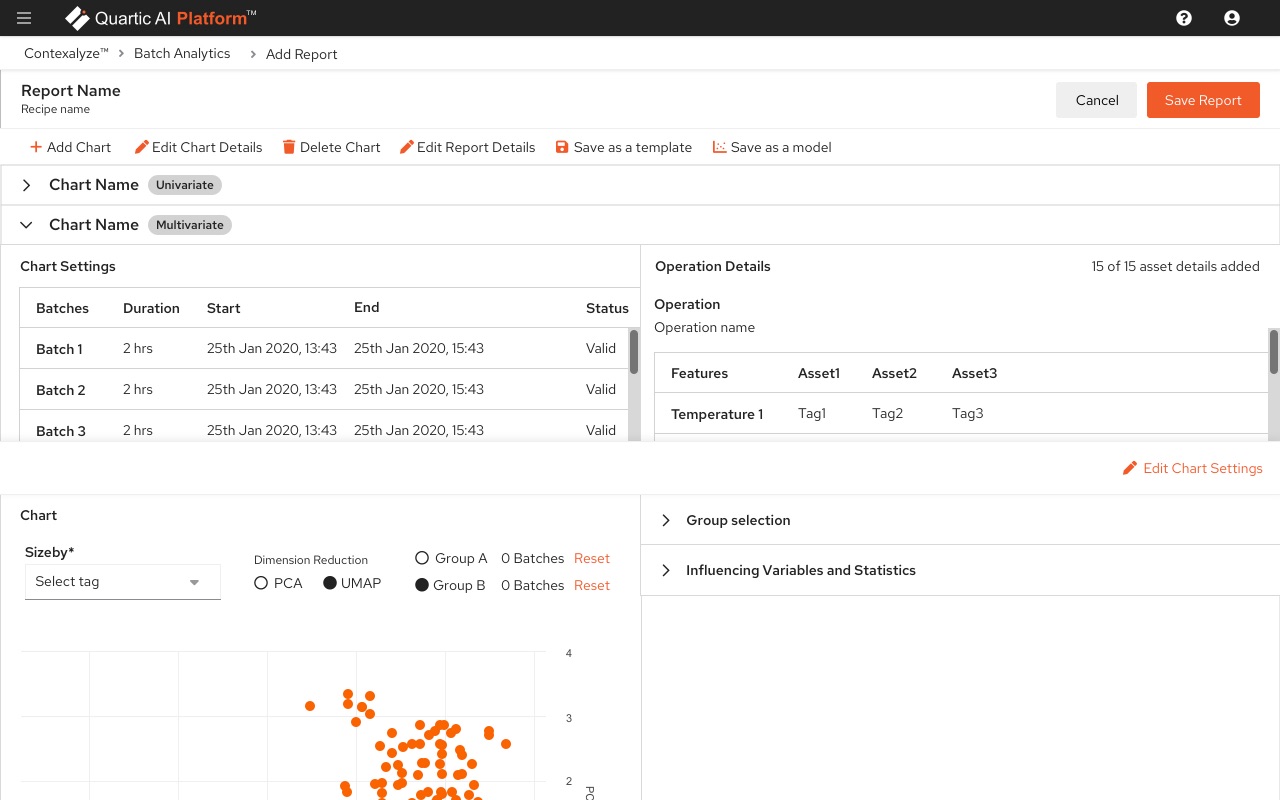
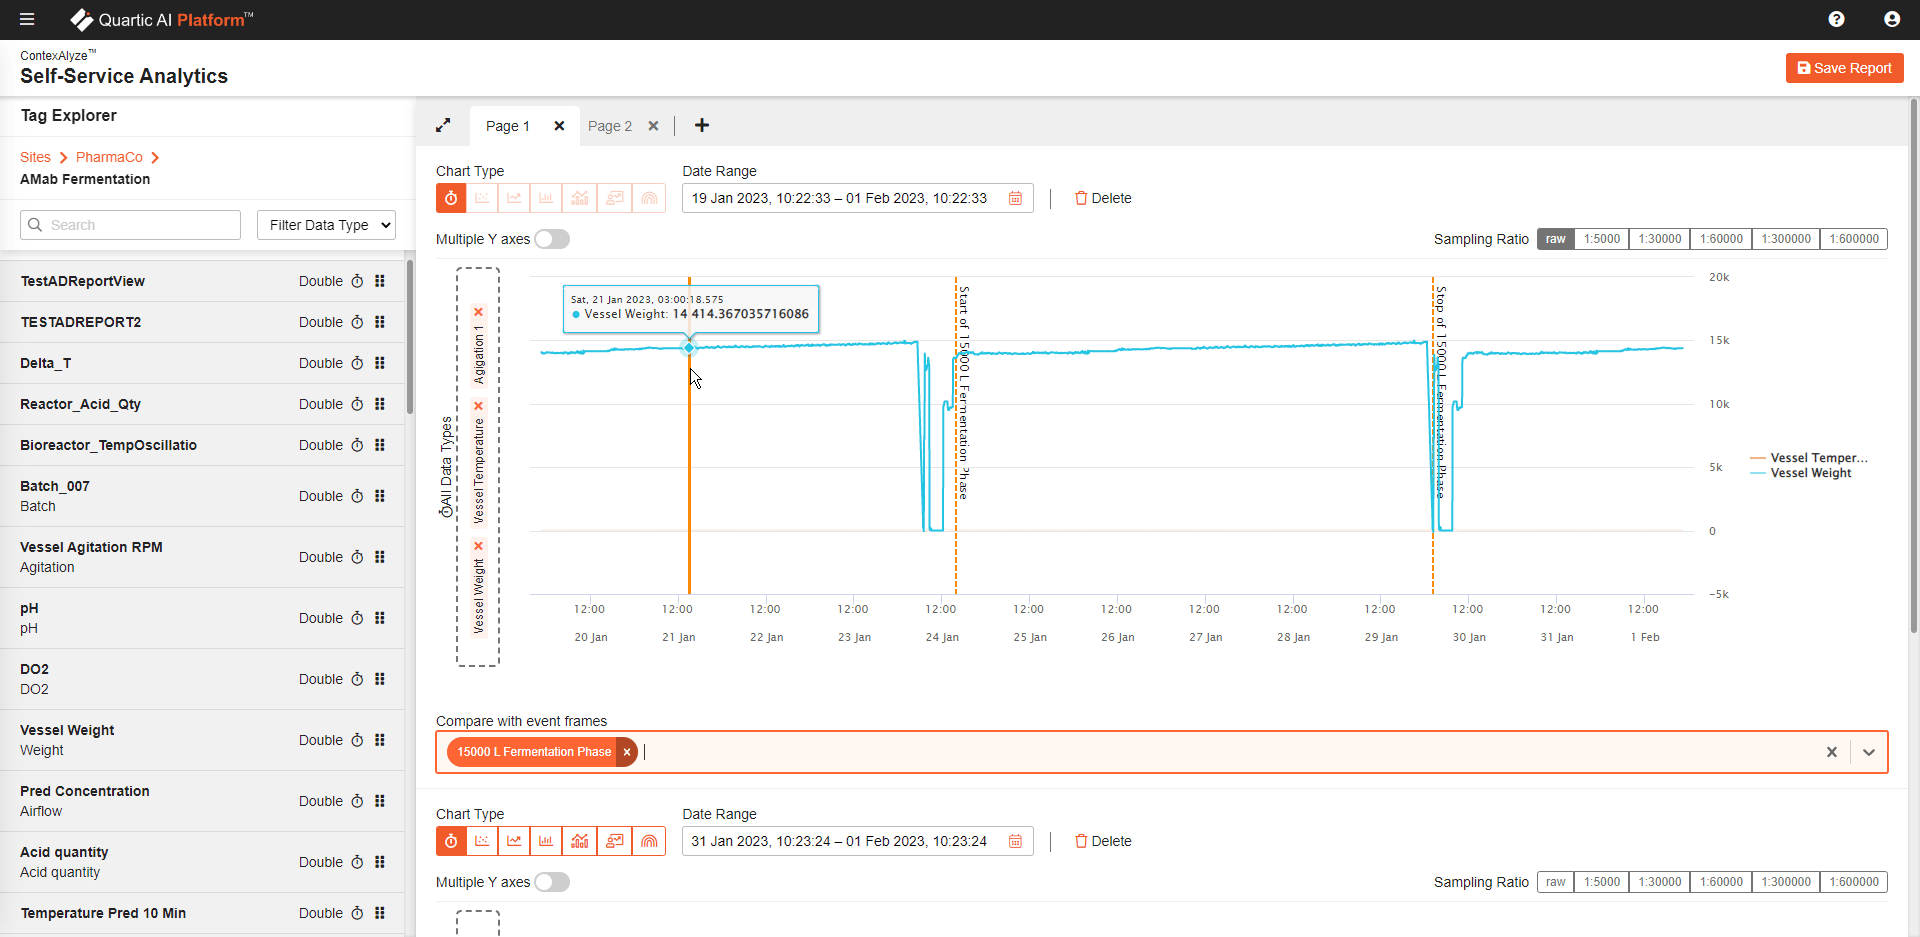
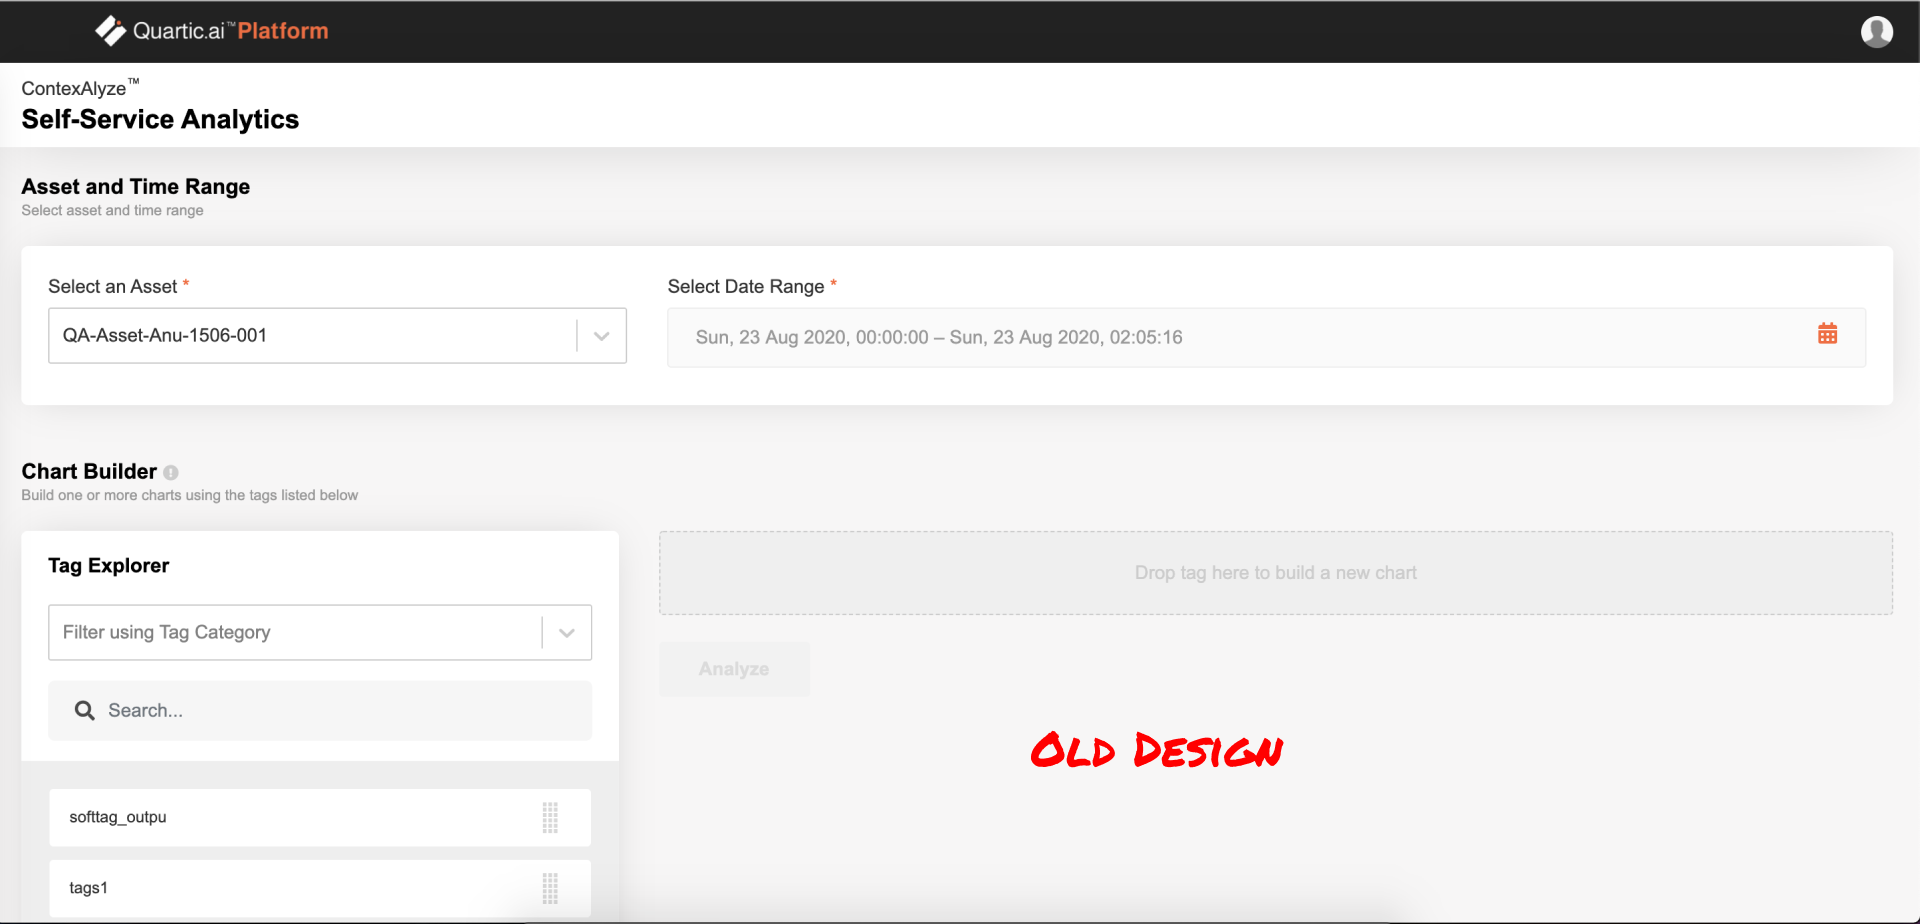
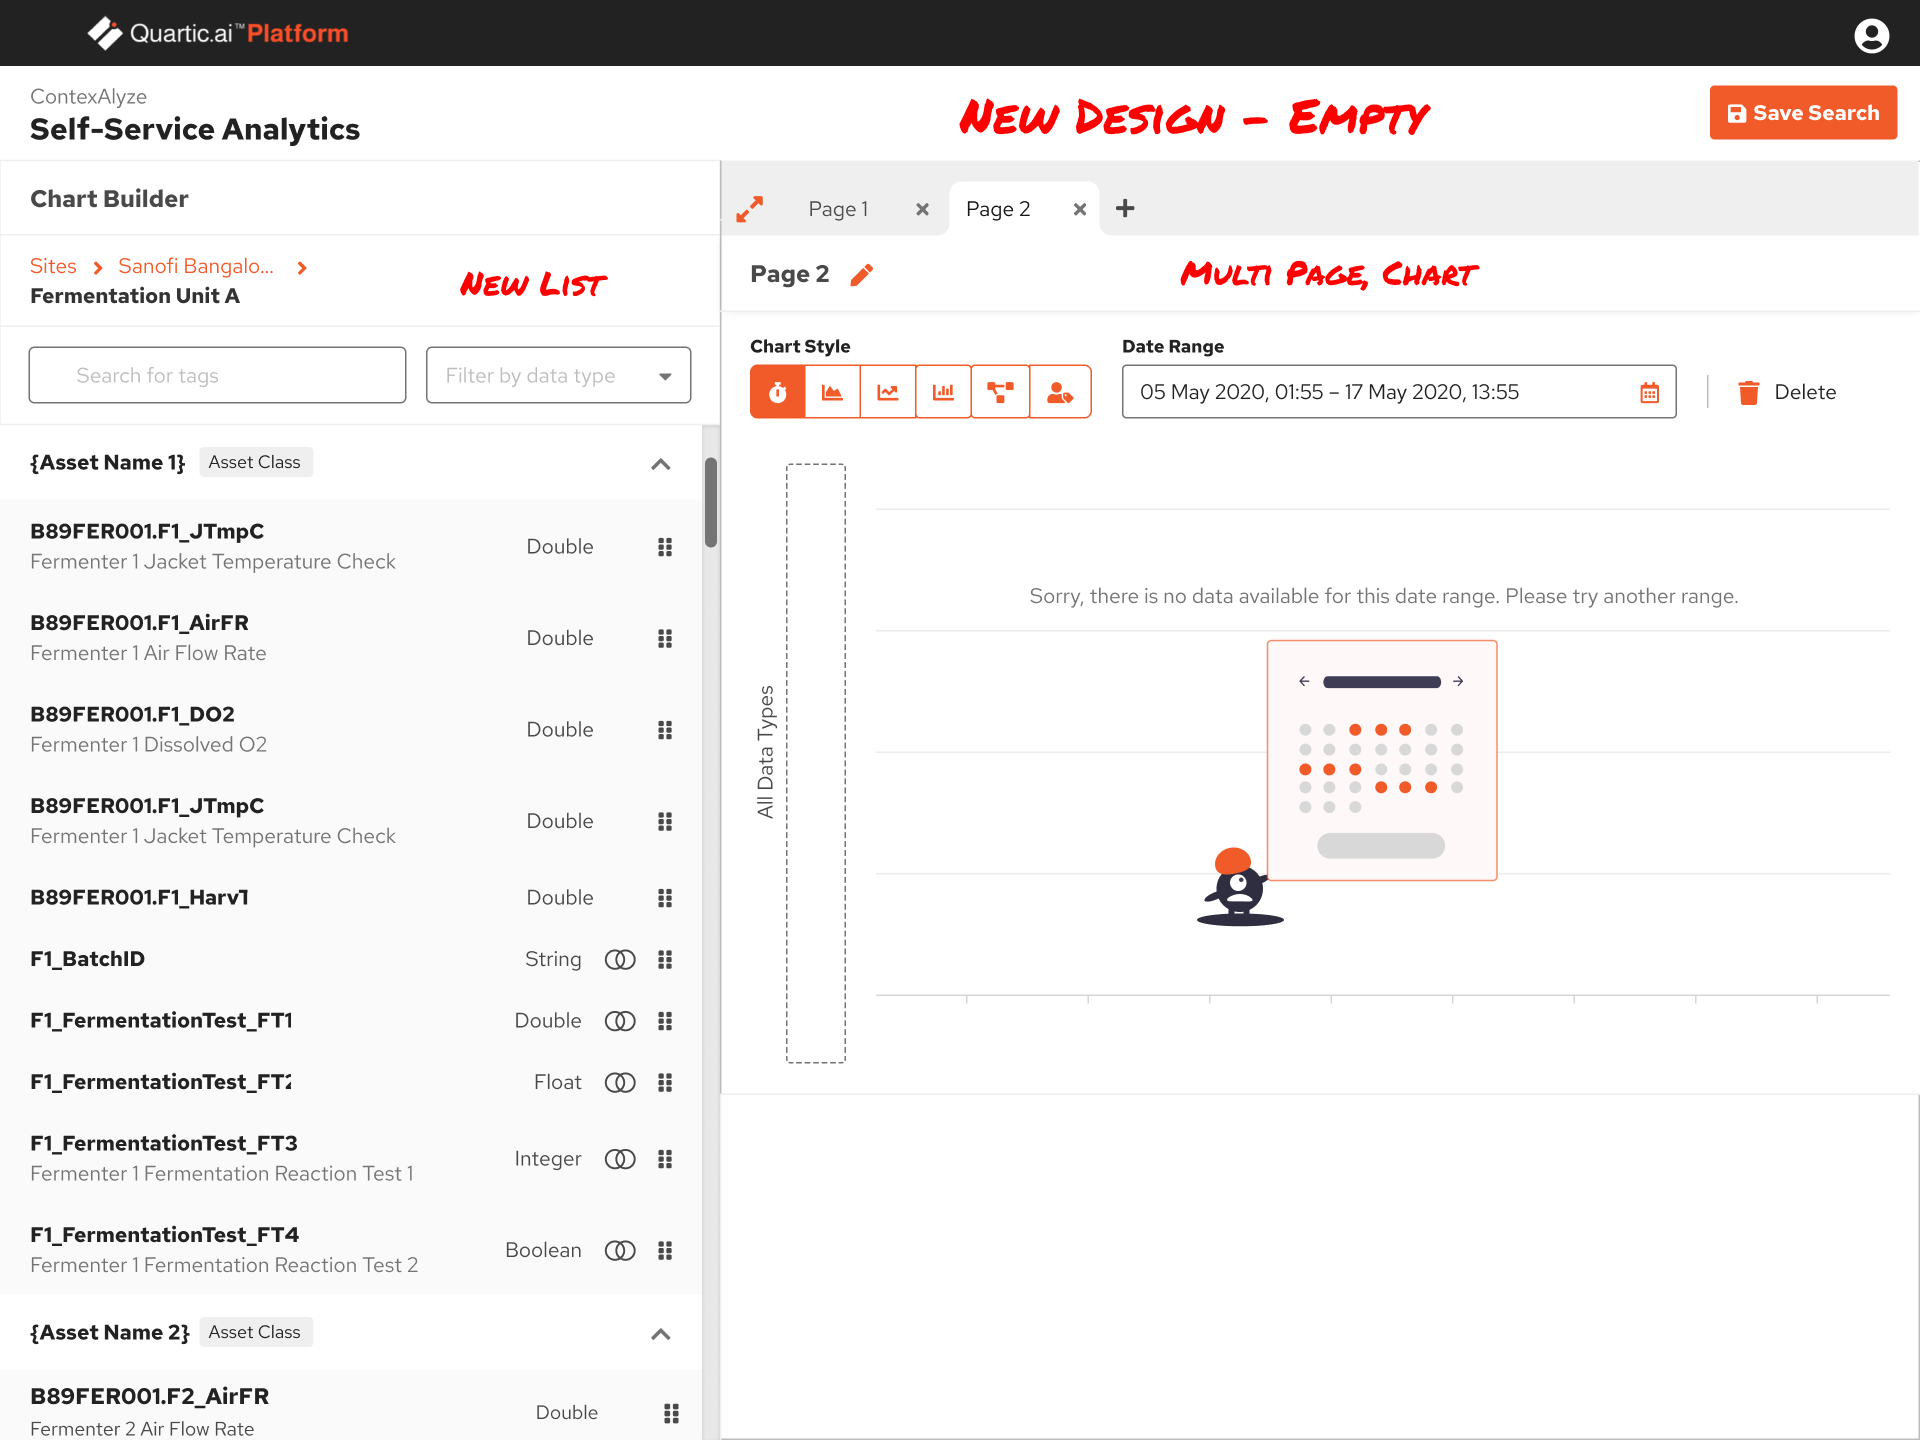
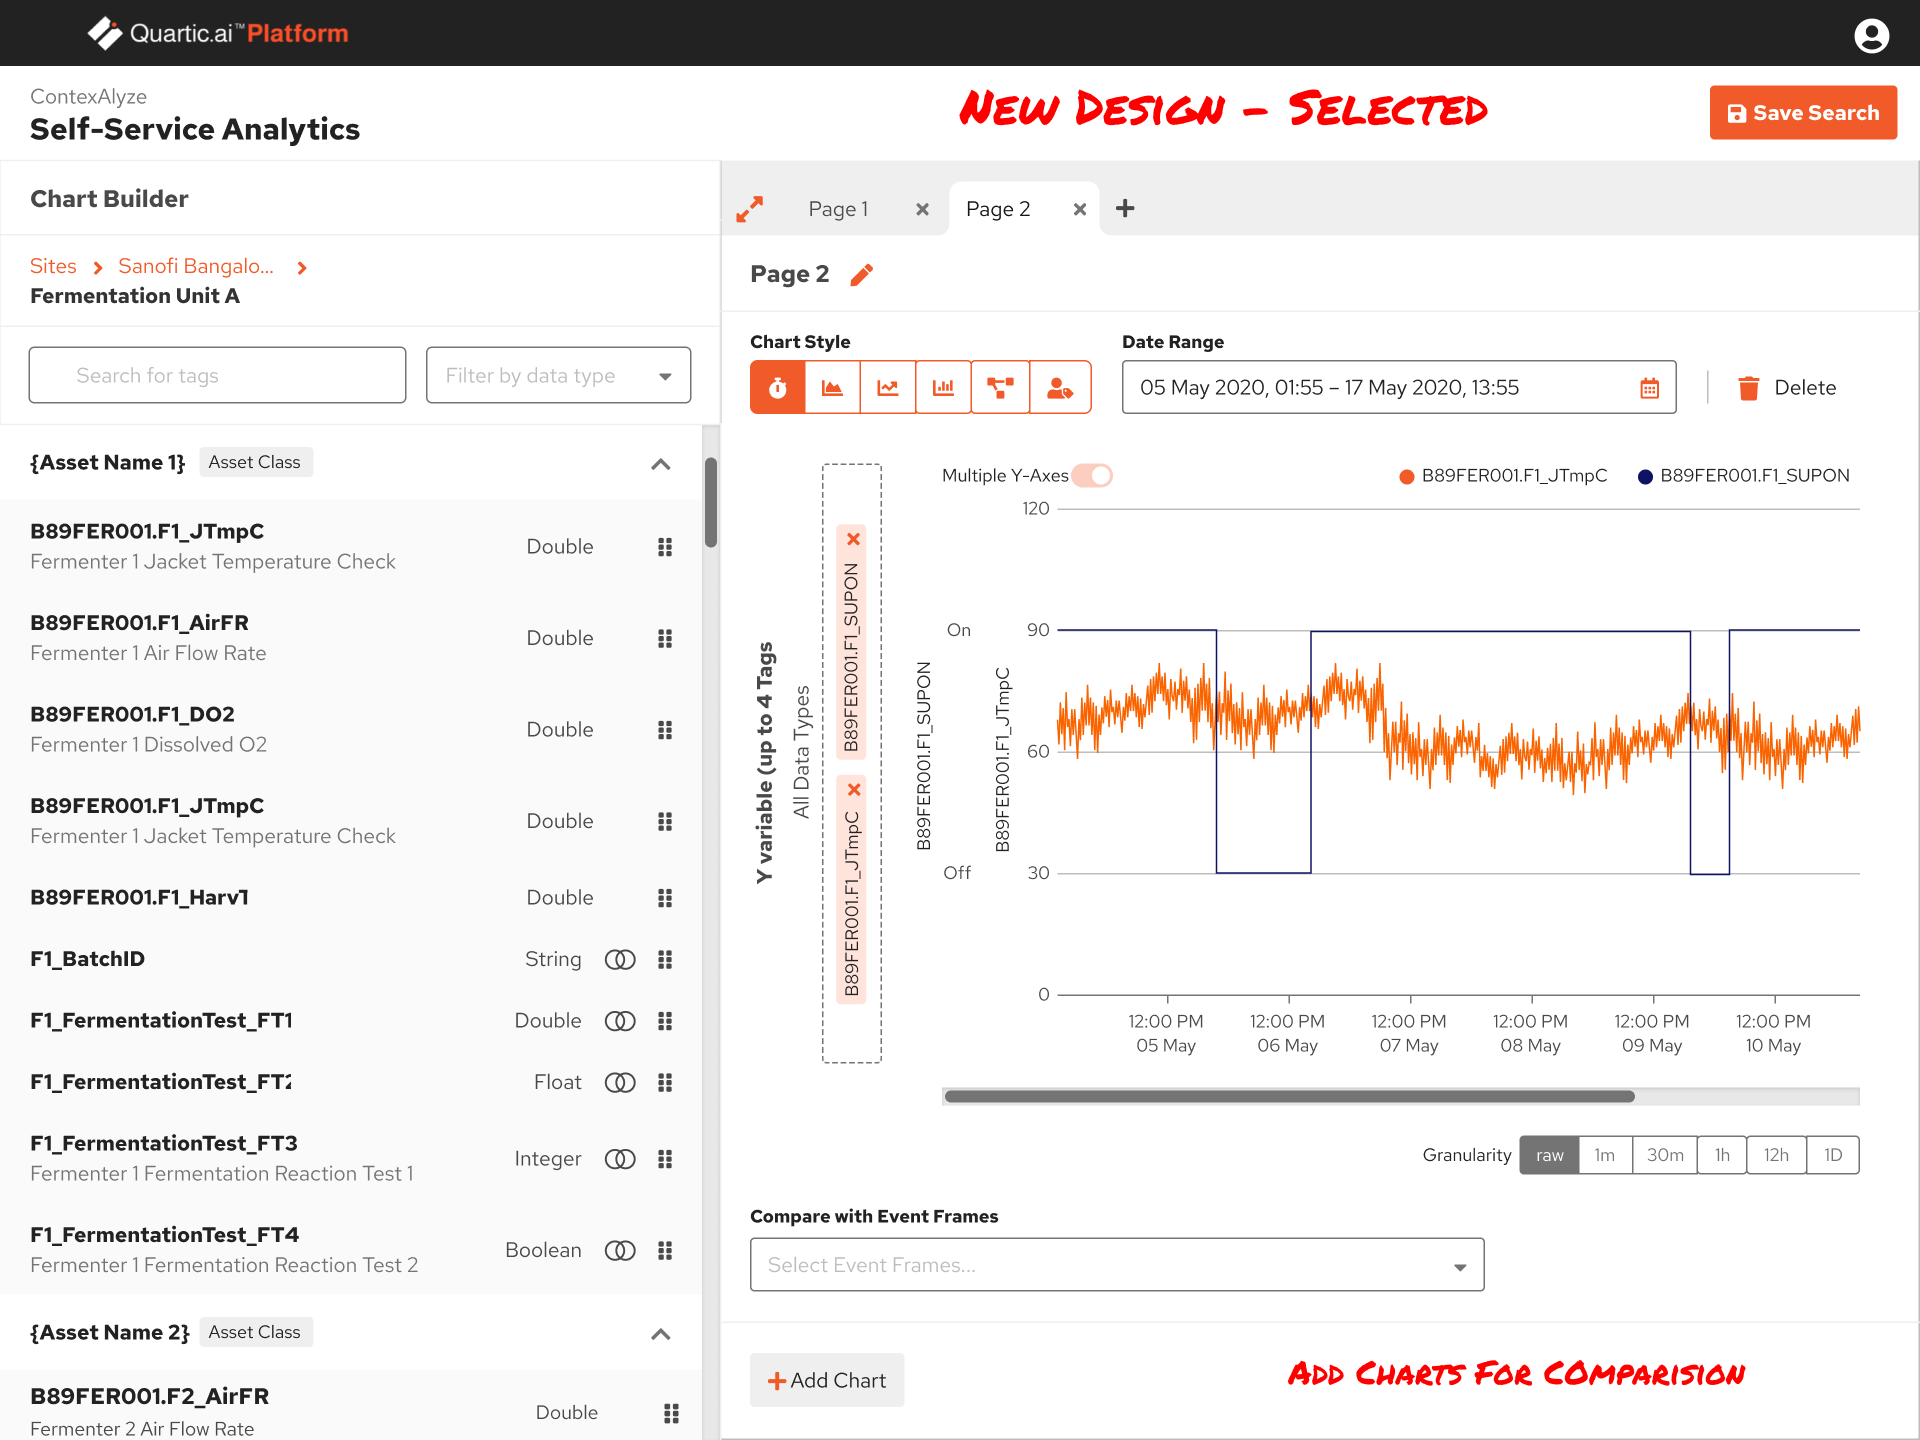
Chart Builder Example
The design below illustrates the before and after screens for the Chart Builder feature, highlighting how the visual complexity increased significantly to provide higher levels of control and information. This enhancement enables users to make informed decisions by identifying contributors and outliers effectively. The updated design supports building multiple charts across multiple pages, allowing comparisons between different runs, batches, and sites. Additionally, it offers extended control over chart types, parameters, and depth, all accessible at the user's fingertips.
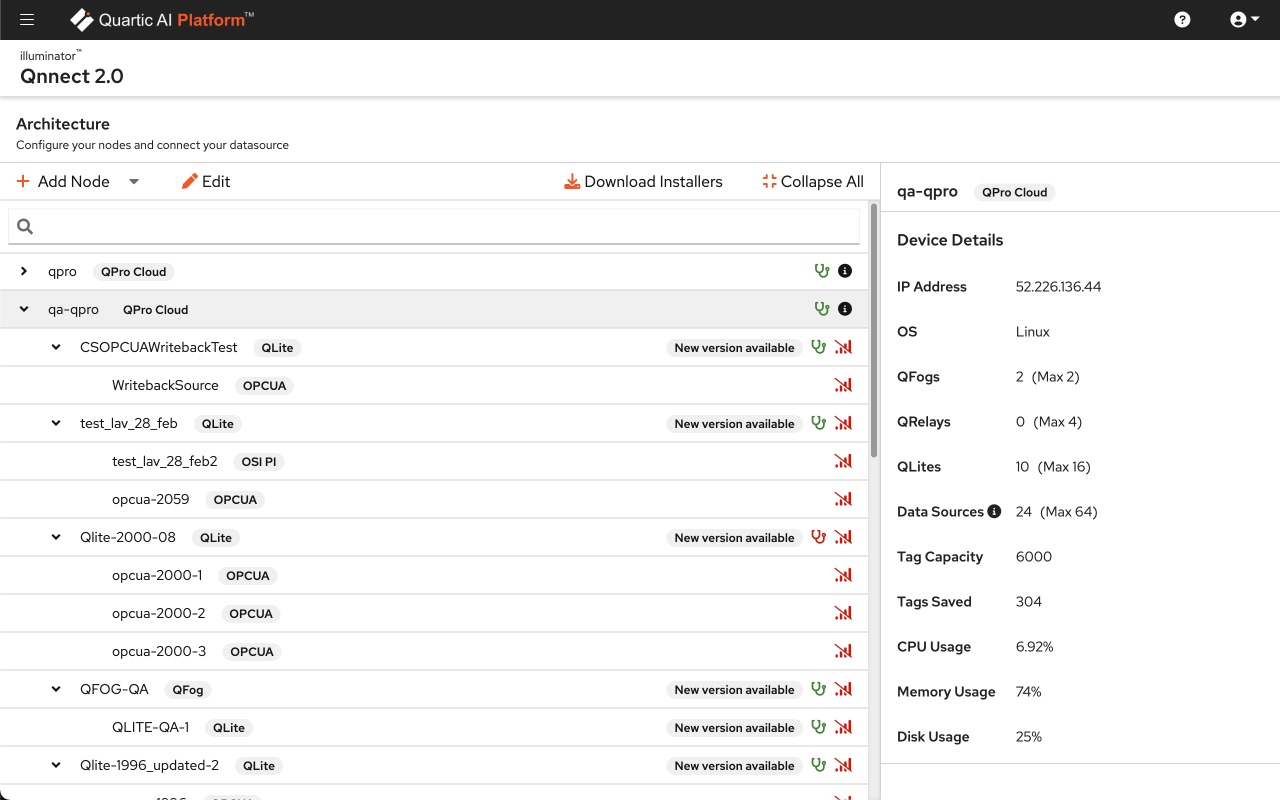
Other Sceens